
Breakout detection in the wild
Friday, 24 October 2014
Nowadays, BigData is leveraged in every sphere of business: decision making for new products, gauging user engagement, making recommendations for products, health care, data center efficiency and more.
A common form of BigData is time series data. With the progressively decreasing costs of collecting and mining large data sets, it’s become increasingly common that companies – including Twitter – collect millions of metrics on a daily basis [1, 2, 3].
Exogenic and/or endogenic factors often give rise to breakouts in a time series. Breakouts can potentially have ramifications on the user experience and/or on a business’ bottom line. For example, in the context of cloud infrastructure, breakouts in time series data of system metrics – that may happen due to a hardware issues – could impact availability and performance of a service.
Given the real-time nature of Twitter, and that high performance is key for delivering the best experience to our users, early detection of breakouts is of paramount importance. Breakout detection has also been used to detect change in user engagement during popular live events such as the Oscars, Super Bowl and World Cup.
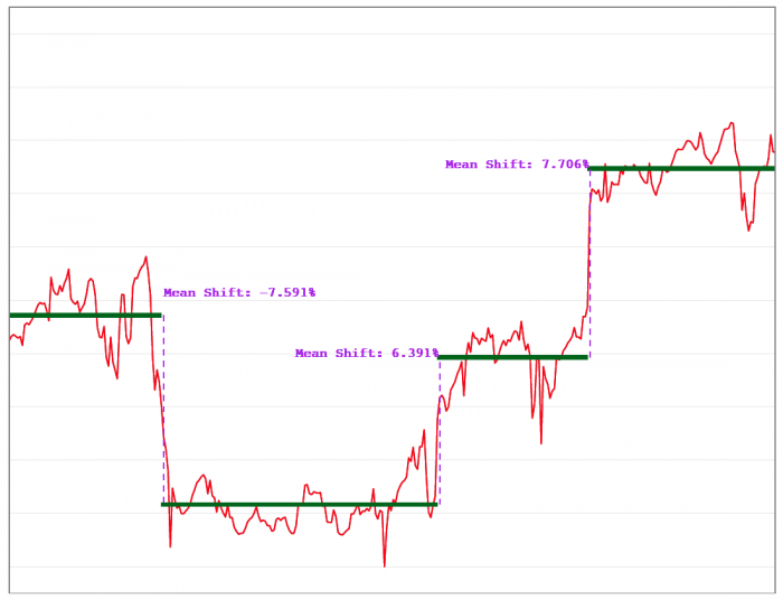
A breakout is typically characterized by two steady states and an intermediate transition period. Broadly speaking, breakouts have two flavors:
The figure below illustrates multiple mean shifts in real data.
Given the ever-growing number of metrics being collected, it’s imperative to automatically detect breakouts. Although a large body of research already exists on breakout detection, existing techniques are not suitable for detecting breakouts in cloud data. This can be ascribed to the fact that existing techniques are not robust in the presence of anomalies (which are not uncommon in cloud data).
Today, we’re excited to announce the release of BreakoutDetection, an open-source R package that makes breakout detection simple and fast. With its release, we hope that the community can benefit from the package as we have at Twitter and improve it over time.
Our main motivation behind creating the package has been to develop a technique to detect breakouts which are robust, from a statistical standpoint, in the presence of anomalies. The BreakoutDetection package can be used in wide variety of contexts. For example, detecting breakout in user engagement post an A/B test, detecting behavioral change, or for problems in econometrics, financial engineering, political and social sciences.
How the package works
The underlying algorithm – referred to as E-Divisive with Medians (EDM) – employs energy statistics to detect divergence in mean. Note that EDM can also be used detect change in distribution in a given time series. EDM uses robust statistical metrics, viz., median, and estimates the statistical significance of a breakout through a permutation test.
In addition, EDM is non-parametric. This is important since the distribution of production data seldom (if at all) follows the commonly assumed normal distribution or any other widely accepted model. Our experience has been that time series often contain more than one breakout. To this end, the package can also be used to detect multiple breakouts in a given time series.
How to get started
Install the R package using the following commands on the R console:
install.packages("devtools")
devtools::install_github("twitter/BreakoutDetection")
library(BreakoutDetection)
The function breakout is called to detect one or more statistically significant breakouts in the input time series. The documentation of the function breakout, which can be seen by using the following command, details the input arguments and the output of the function breakout.
help(breakout)
A simple example
To get started, the user is recommended to use the example dataset which comes with the packages. Execute the following commands:
data(Scribe)
res = breakout(Scribe, min.size=24, method='multi', beta=.001, degree=1, plot=TRUE)
res$plot
The above yields the following plot:
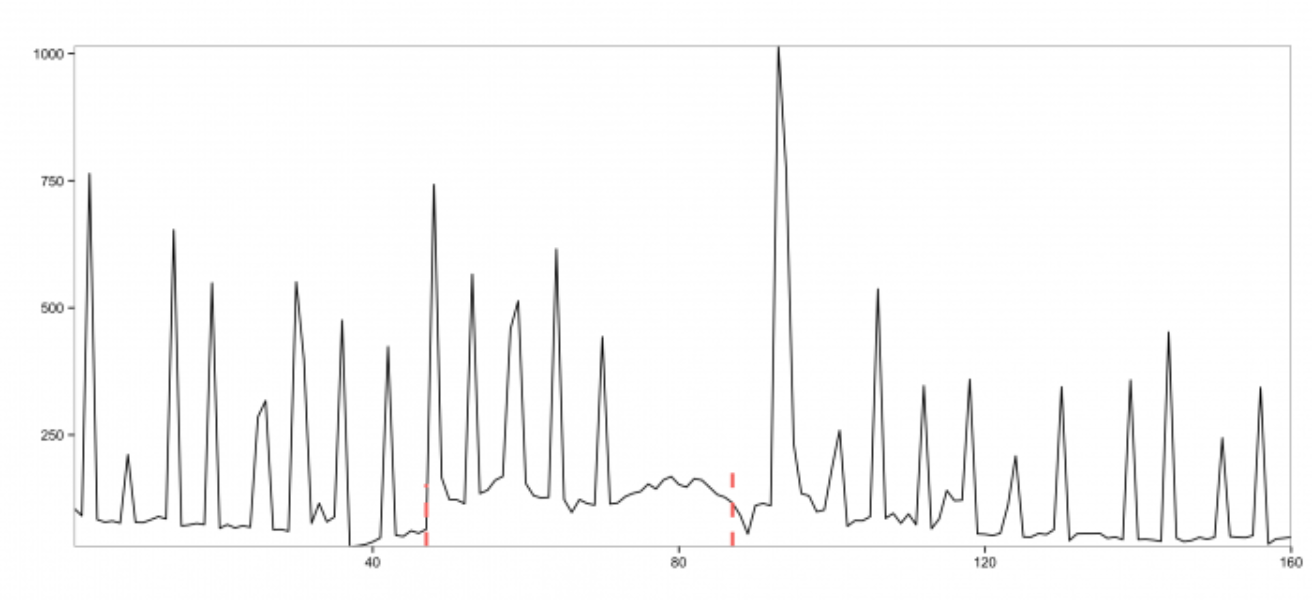
From the above plot, we observe that the input time series experiences a breakout and also has quite a few anomalies. The two red vertical lines denote the locations of the breakouts detected by the EDM algorithm. Unlike the existing approaches mentioned earlier, EDM is robust in the presence of anomalies. The change in mean in the time series can be better viewed with the following annotated plot:
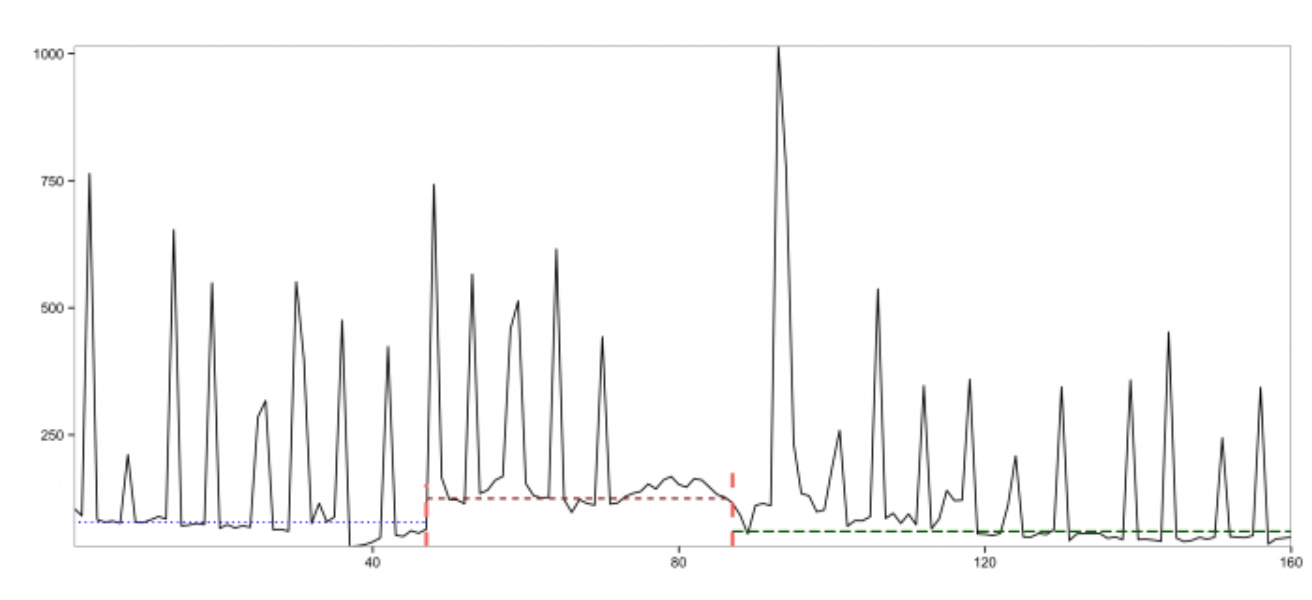
The horizontal lines in the annotated plot above correspond to the approximate (i.e., filtering out the effect of anomalies) mean for each window.
Acknowledgements
We thank James Tsiamis and Scott Wong for their support and Nicholas James as the primary researcher behind this research.
Did someone say … cookies?
X and its partners use cookies to provide you with a better, safer and
faster service and to support our business. Some cookies are necessary to use
our services, improve our services, and make sure they work properly.
Show more about your choices.