PubNub recently released a demo Twitter stream published through their hosted websockets. The stream can be consumed on a variety of platforms using one of their many SDKs. In Part 1 of this two-part series, guest blogger and PubNub Developer Advocate Tomomi Imura will walk you through creating a cartographic visualization using D3, Twitter data and the PubNub API.
If you’re trying to build awesome web applications by processing Twitter streaming data, wouldn’t it be great if you could skip the complicated process of long polling and just write front-end code with JavaScript? The @PubNub real-time public Twitter stream makes that possible for you.
The PubNub data stream network allows you to send and receive JSON data on any device using persistent socket connections. Now, with PubNub’s newly announced real-time Twitter stream, you can consume this public data without hassle.
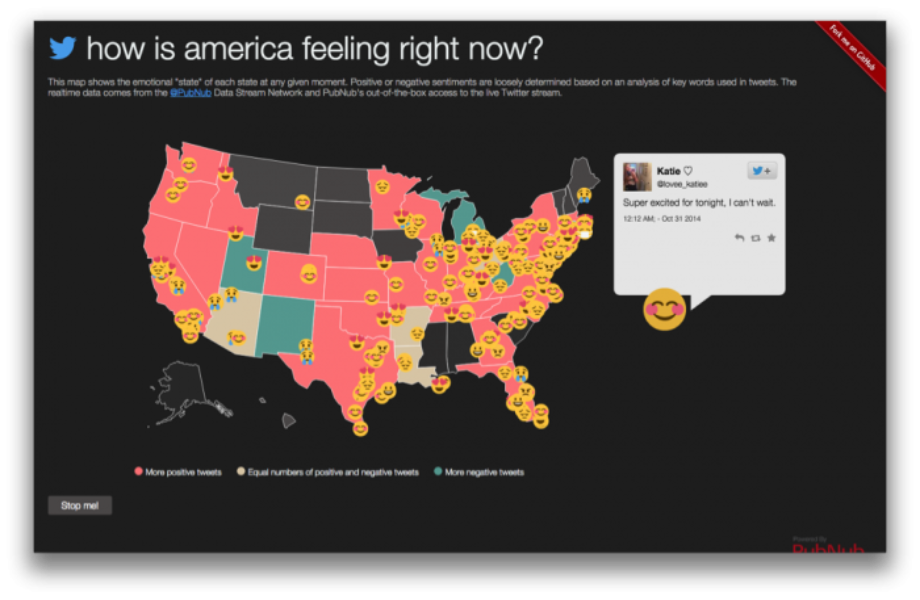
 The demo above displays a simple Twitter data analysis of how people in U.S. are feeling based on how they’re Tweeting at any given moment. The demo looks for certain words and emoticons in the incoming Twitter stream that indicate a person’s mood, and then maps it by state.
First, check out this Twitter emotion stream app first. Then continue reading the article and view the entire source code on Github.
In this tutorial, you will learn how to create a cartographic visualization with real-time data by:
For this tutorial, you’ll need basic-to-intermediate knowledge of JavaScript Document Object Model (DOM), and basic understanding of SVG and D3.js.
The U.S. map you see in the demo is actually in JSON, and rendered in SVG with D3.js d3.geo.path.
TopoJSON is an extension of GeoJSON, which encodes topology and is used to represent geographic features with JavaScript. The difference is that TopoJSON only includes the data you need to render, and the size can be significantly smaller.
This is how the United States map looks in JSON. (GitHub now supports rendering GeoJSON map files within repositories, so you may want to click “Raw” or “Blame” to see in raw JSON file.)
OK, let’s get started. Rendering TopoJSON is incredibly easy when you are using D3.
var svg = d3.select('#map').append('svg').attr('width', 900).attr('height', 550);

var path = d3.geo.path().projection(d3.geo.albersUsa());

var g = svg.append('g');

d3.json('us-states.json', function(error, topology) {
  g.selectAll('path')
    .data(topojson.feature(topology, topology.objects.usStates).features)
    .enter().append('path')
    .attr('class', function(d){ return 'states ' + d.properties.STATE_ABBR;} )
    .attr('d', path)
    .attr('fill', 'gray')
});
Notice that we are assigning an abbreviated state name as a class name, so you can give or modify color for each state later.
Getting the live JSON data from the PubNub stream is really simple.
First, you need to sign up for API Keys for a free PubNub account. Then, include the PubNub JavaScript libraries in your HTML.
<script src="//cdn.pubnub.com/pubnub.min.js"></script>
We are using a public stream called pubnub-twitter, so let’s initialize the API with the channel name and a public key.
var channel = 'pubnub-twitter';

var pubnub = PUBNUB.init({
  subscribe_key: 'sub-c-78806dd4-42a6-11e4-aed8-02ee2ddab7fe'
});
To retrieve the live Tweets, you simply use PubNub subscribe() API.
pubnub.subscribe({
  channel: channel,
  callback: processData
});
Once you successfully retrieve the data from the stream, call the callback function, let’s call it processData, to consume the data. You can take a look at the stream of data in this Twitter stream console.
Create a mini dictionary that describes moods to pseudo-analyze Tweets.
var positiveWords = [
  'excellent', 'amazing', 'happy', 'magnificent', ':)', ...
];
var negativeWords = [
  'unhappy', 'sorry', 'annoyed', 'dislike', 'anxious', ':(', ...
];
See if these words are used in each Tweet, in the callback function, ‘processData()’.
function processData(data) {
  // looking for US data only for this demo
  if(data.place.country_code !== 'US') return;

  // Check if emotional words are used in the tweet
  if (positiveWords.some(function(v) { return data.text.toLowerCase().indexOf(v) > 0; })) {
    displayData(data, positive);
  } else if
    ...
}
Take only information you need from the entire Tweet object. In this case, extract the user’s location from the schema. Remember, we have set an abbreviated state name as a class attribute in the SVG path. Now we are going to use the user’s home state to match the map path.
function displayData(data, emotion) {
  var state = data.place.full_name.substring(city.lastIndexOf(',')+1).trim();

  if(document.querySelector('.'+state)) {
  var stateEl = document.querySelector('.'+state);

  // count
  tally[state] = (tally[state] || {positive: 0, negative: 0});
  tally[state][emotion] = (tally[state][emotion] || 0) + 1;

  // colorize svg path
  stateEl.style.fill = (tally[state].positive > tally[state].negative) ? 'pink' : ((tally[state].positive < tally[state].negative) ? 'turquoise' : 'beige');
    }
  }
}
Ta-da! You’ve just live-analyzed Tweets from the entire United States and turned them into a cartographic visualization!
We hope you enjoyed this tutorial. If you would like to explore this demo, see the entire source code of the demo on GitHub. And if you haven’t already, be sure to sign up for PubNub to create awesome real-time apps!
@TwitterDev would like to thank Tomomi Imura and @PubNub for creating these great demo apps using Twitter data. The NodeJS source code for interfacing with the Twitter streaming/filter API and publishing with the PubNub API is also available in this GitHub Gist. For detailed documentation on the Twitter API, be sure to visit dev.twitter.com.
Did someone say … cookies?
X and its partners use cookies to provide you with a better, safer and
faster service and to support our business. Some cookies are necessary to use
our services, improve our services, and make sure they work properly.
Show more about your choices.