
Using Twitter to measure earthquake impact in almost real time
Friday, 2 May 2014
At Twitter, we know that Tweets can sometimes travel as fast as an earthquake. We were curious to know just how accurate such a correlation might be, so we collaborated with Stanford researchers to model how Tweets can help create more accurate ShakeMaps, which provide near-real-time maps of ground motion and shaking intensity following significant earthquakes.
These maps are used by federal, state and local organizations, both public and private, for post-earthquake response and recovery, public and scientific information, as well as for preparedness exercises and disaster planning.
Currently, ShakeMaps produced by the U.S. Geological Survey represent the state-of-the-art rapid shaking intensity estimation. When an earthquake happens, a ShakeMap is typically produced in a matter of minutes using a combination of recordings, a simple ground motion prediction equation, and geological site correction factors. As time progresses, the ShakeMap is continually updated as new information becomes available, including “did you feel it?” data — qualitative first-hand accounts of the earthquake collected via online surveys.
To help improve the accuracy of ShakeMaps, we used all geo-tagged Tweets around the world containing the keyword “earthquake” or “tsunami” in several languages that occurred in the first 10 minutes following Japanese earthquakes of magnitude 6 or greater from 2011 to 2012. We found that the model with lowest error was based on a combination of earthquake and Tweet-based features, such as local site conditions, source-to-site distance and the number of Tweets within a certain radius. Ground shaking intensity estimates from our model are comparable with historical recordings and conventional estimates provided, for example, by USGS ShakeMaps.
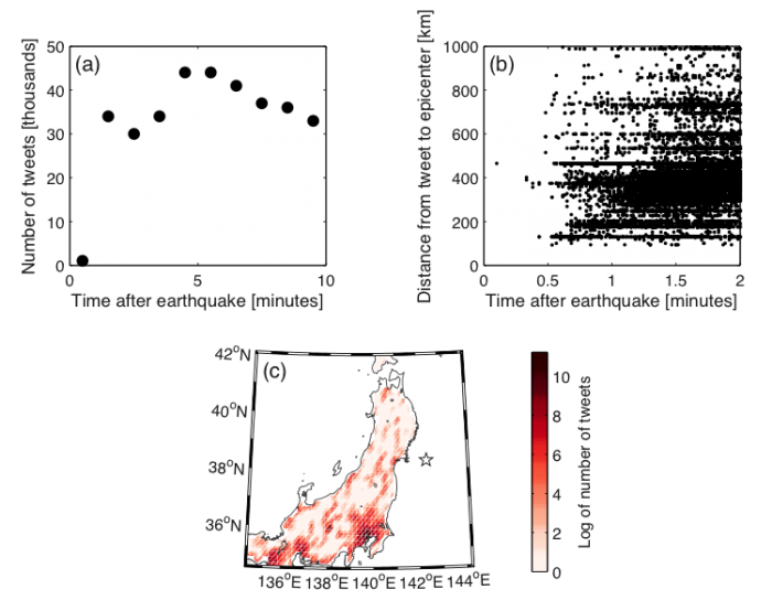
Figure 1. For the Tohoku (c0001xgp) earthquake: (a) number of geo-tagged Tweets containing an earthquake keyword per minute after the event, (b) distance between each Tweet and the epicenter as a function of time, and (c) map showing the number of Tweets, where the star represents the epicenter location.
Figure 1 shows Tweet activity following a significant earthquake. From these, we generated 8 Tweet-based features, each considered within varying radii of a recording station. They included: count of Tweets, average number of tokens, average number of characters, average index of first mention of an earthquake keyword, average number of appearances of earthquake keywords, average number of exclamation points, average number of dashes and average number of appearances of a selected Japanese keyword. With these features, we trained several models, including a simple linear regression, elastic net regression and k-Nearest-Neighbors regression. For a more thorough description, you can read this paper, which we’ll present in July at the National Conference on Earthquake Engineering.
Reference:
Rapid Estimate of Ground Shaking Intensity by Combining Simple Earthquake Characteristics with Tweets
Mahalia Miller, Lynne Burks, Reza Zadeh
Tenth U.S. National Conference on Earthquake Engineering
Did someone say … cookies?
X and its partners use cookies to provide you with a better, safer and
faster service and to support our business. Some cookies are necessary to use
our services, improve our services, and make sure they work properly.
Show more about your choices.