
Visualizing reactions to the #SOTU
Wednesday, 29 January 2014
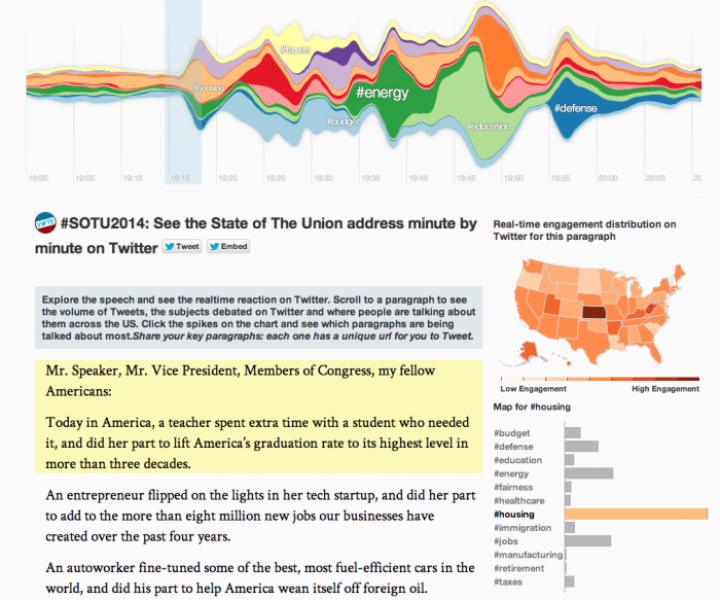
When the President gave his State of the Union (#SOTU), the world reacted instantly, on Twitter. We want to show you what that looks like so you can see how people reacted to the big moments during the speech.
This interactive visualization, designed by our own data viz scientist Nicolas Belmonte, does exactly that: It links every paragraph in @BarackObama’s #SOTU with the thousands of Tweets that came in response to their delivery so you can see the resonance of each topic discussed in the speech:
 Click image above to explore the interactive graphic.
Click the peaks on the chart to see which points in the speech they correspond to, or view how the debate resonated with people across the U.S., by state and by topic. For example, you can see that Obama’s discussion of defense issues resonated highly in the mid-west, while the healthcare sections provoked strong reactions in southern states such as Alabama. Click on the graphics to dive deeper into the speech to watch reaction unfold.
Did someone say … cookies?
X and its partners use cookies to provide you with a better, safer and
faster service and to support our business. Some cookies are necessary to use
our services, improve our services, and make sure they work properly.
Show more about your choices.