
Guest post: Analyzing an NHL game through the Twitter APIs
Wednesday, 18 March 2015
Early on when I was experimenting with Tweepy, I began thinking of interesting projects that could come out of all this data I had the potential of collecting. One idea that always stuck was the thought of collecting Tweets during sports games and seeing what could be done with the resulting data. Being a Philadelphia Flyers (@NHLFlyers) fan, I chose to use Twitter’s streaming API to collect Tweets sent during their last playoff game against the New York Rangers (@NYRangers). (Spoiler alert: my Flyers lost).
The following code takes all Tweets with the keyword ‘flyers’ and sends the time it was created, text of the Tweet, location (if available) and the source of the Tweet to a local MongoDB database. Even though I removed my consumer and secret keys, you can obtain your own by creating an app on Twitter’s dev site.
import tweepy
import sys
import pymongo

consumer_key=""
consumer_secret=""

access_token=""
access_token_secret=""

auth = tweepy.OAuthHandler(consumer_key, consumer_secret)
auth.set_access_token(access_token, access_token_secret)
api = tweepy.API(auth)

class CustomStreamListener(tweepy.StreamListener):
    def __init__(self, api):
        self.api = api
        super(tweepy.StreamListener, self).__init__()

        self.db = pymongo.MongoClient().Flyers

    def on_status(self, status):
        print status.text , "\n"

        data ={}
        data['text'] = status.text
        data['created_at'] = status.created_at
        data['geo'] = status.geo
        data['source'] = status.source

        self.db.Tweets.insert(data)

    def on_error(self, status_code):
        print >> sys.stderr, 'Encountered error with status code:', status_code
        return True # Don't kill the stream

    def on_timeout(self):
        print >> sys.stderr, 'Timeout...'
        return True # Don't kill the stream

sapi = tweepy.streaming.Stream(auth, CustomStreamListener(api))
sapi.filter(track=['flyers'])
Once you run the script you will see the Tweets appear on the terminal window and the MongoDB begin to fill. I use the Robomongo GUI to keep track of this. I ran the script fifteen minutes prior to the beginning of the game and ended it fifteen minutes after for the sake of consistency. By the end I had collected 35,443 Tweets. For a little bit of context I was collecting around 7,000 Tweets for regular season Flyers games and was able to gather 640,000 during the Super Bowl.

Once I had all of the data collected I exported a CSV of everything and began looking at it in iPython. The code below creates a pandas dataframe from the CSV file, makes the created_at column into the index and then converts it to a pandas time series. I also converted the time to EST 12 hour format for graph readability.
import pandas as pd
from pandas.tseries.resample import TimeGrouper
from pandas.tseries.offsets import DateOffset
flyers = pd.readcsv('/Users/danielforsyth/Desktop/PHINYRG3.csv')
flyers['createdat'] = pd.todatetime(pd.Series(flyers['createdat']))
flyers.setindex('createdat', drop=False, inplace=True)
flyers.index = flyers.index.tzlocalize('GMT').tzconvert('EST')
flyers.index = flyers.index - DateOffset(hours = 12)
flyers.index
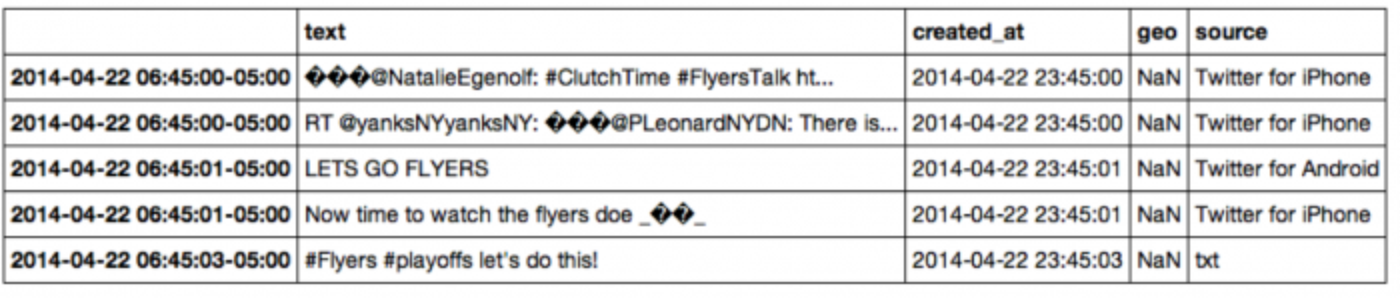
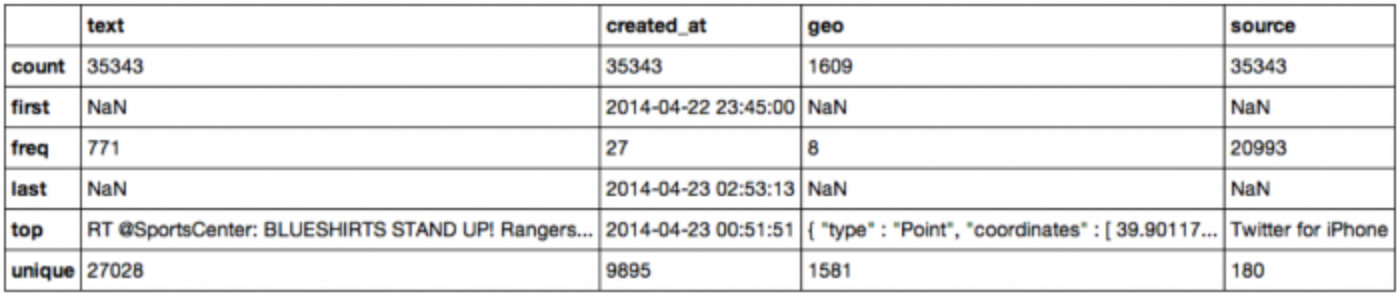
 Next I took a quick look at everything using the head and described methods built into pandas.
flyers.head()
flyers.describe()
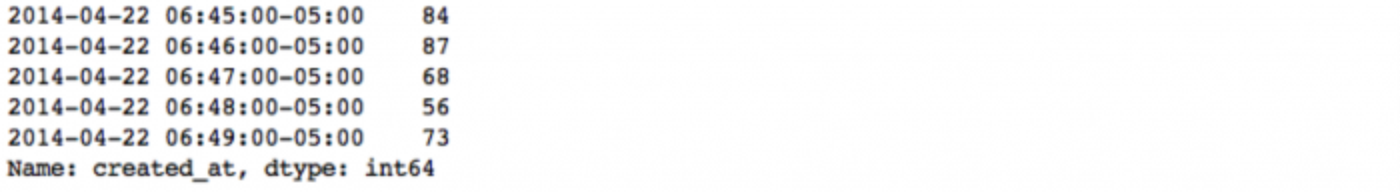
Now it was time to get the data ready to graph. One quick line and the created_at time series is in a per minute minute format.
flyers1m = flyers['created_at'].resample('1t', how='count')
flyers1m.head()
You can also quickly find the average amount of Tweets per minute. Which in this case was 187.
avg = flyers1m.mean()
Now that I had all of the data formatted properly I imported Vincent and created a graph.
import vincent
vincent.core.initialize_notebook()
area = vincent.Area(flyers1m)
area.colors(brew='Spectral')
area.display()
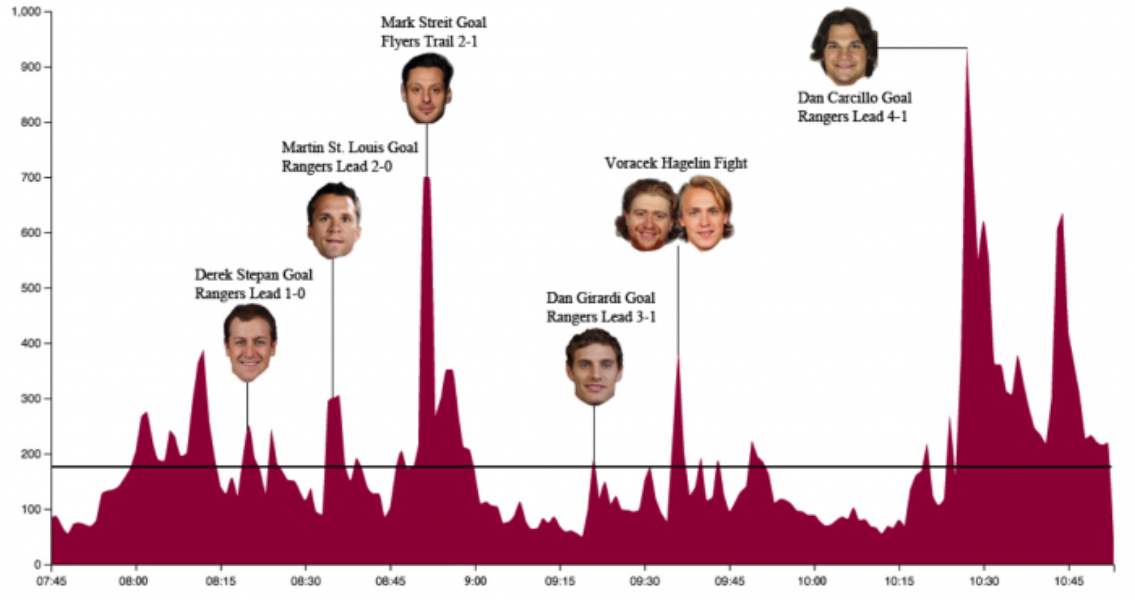
Because the search term used here was ‘flyers’ the results are very biased towards them. The two highest peaks in Tweet volume are during the first Flyers goal (700 Tweets per minute) and the final Rangers goal by ex-Flyer Dan Carcillo (938 Tweets per minute). There are also two large peaks at the beginning and end of the game.
This was a very interesting project with some pretty cool results, especially considering I was only using around one percent of all the Tweets being sent during the game. If you have any questions, feedback or advice, please get in touch with me on Twitter.
Note: This post is edited and abridged from the original version; to get more detail on geo-locating NHL Tweets and identifying fans, read the original post.
Did someone say … cookies?
X and its partners use cookies to provide you with a better, safer and
faster service and to support our business. Some cookies are necessary to use
our services, improve our services, and make sure they work properly.
Show more about your choices.