
Track the pulse of the US presidential race
By
Tuesday, 10 May 2016
If you’ve got something to say about politics, chances are you’re Tweeting it. In the last week alone, there have been more than 16 million Tweets sent about the presidential election in the US.
Voters, journalists, and candidates are all contributing to this national conversation, all from different points-of-view, in different languages, and around diverse issue areas. Twitter is the live pulse of the 2016 presidential election, and we’ve been crunching the numbers to show how the race has unfolded so far.
Today, we launched this interactive data visualization that allows you to see how the Twitter buzz about each candidate has shifted week over week since September.
The rankings are based on the number of users Tweeting about each candidate plus users engaging with those Tweets. The default view shows the candidate’s performance as a ranking chart, focusing on how they rank relative to each other for all US conversation.
You can explore the visualization in several different ways:
Here are a few insights based on the data:
When you take a look at national Twitter buzz about the two remaining Democratic candidates, you can see that Clinton led Sanders last week (Image 1). But by narrowing the search, you can see that Sanders took the lead over Clinton in the level of buzz in Indiana prior to his primary win (Image 2).
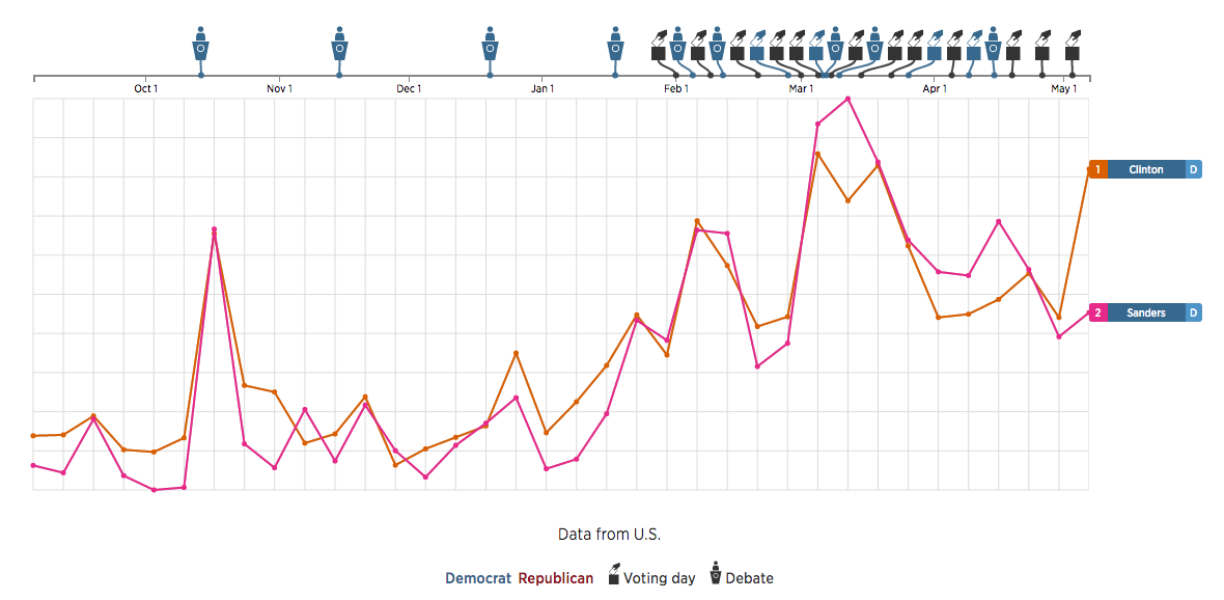 Image 1
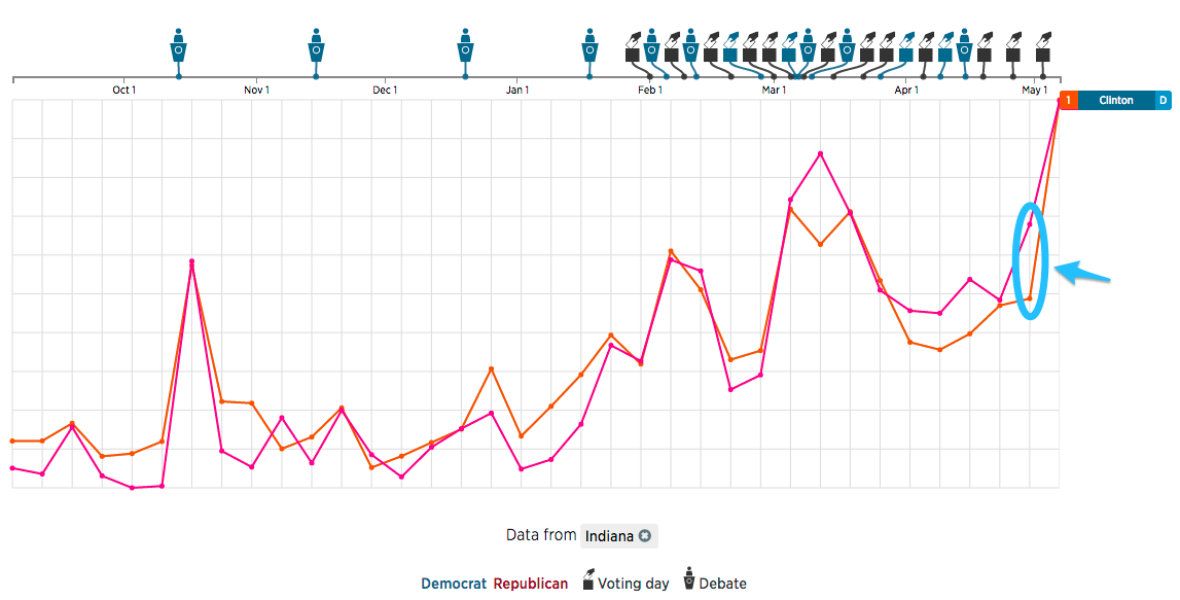 Image 2
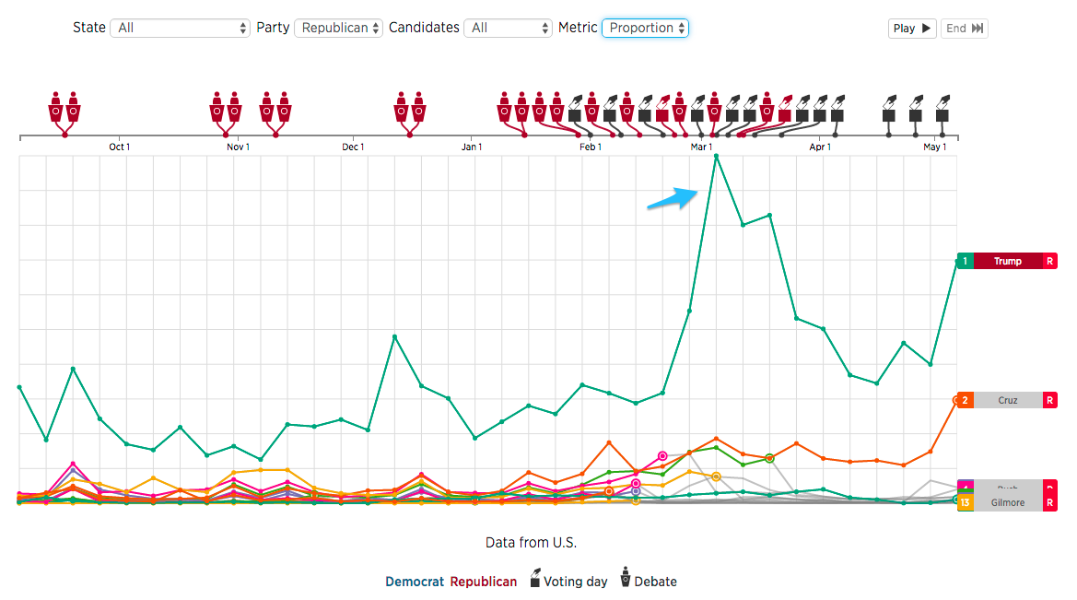
Trump’s dominance of the national Twitter conversation peaked on Super Tuesday (March 1), and he’s held the top spot the entire election cycle thus far:
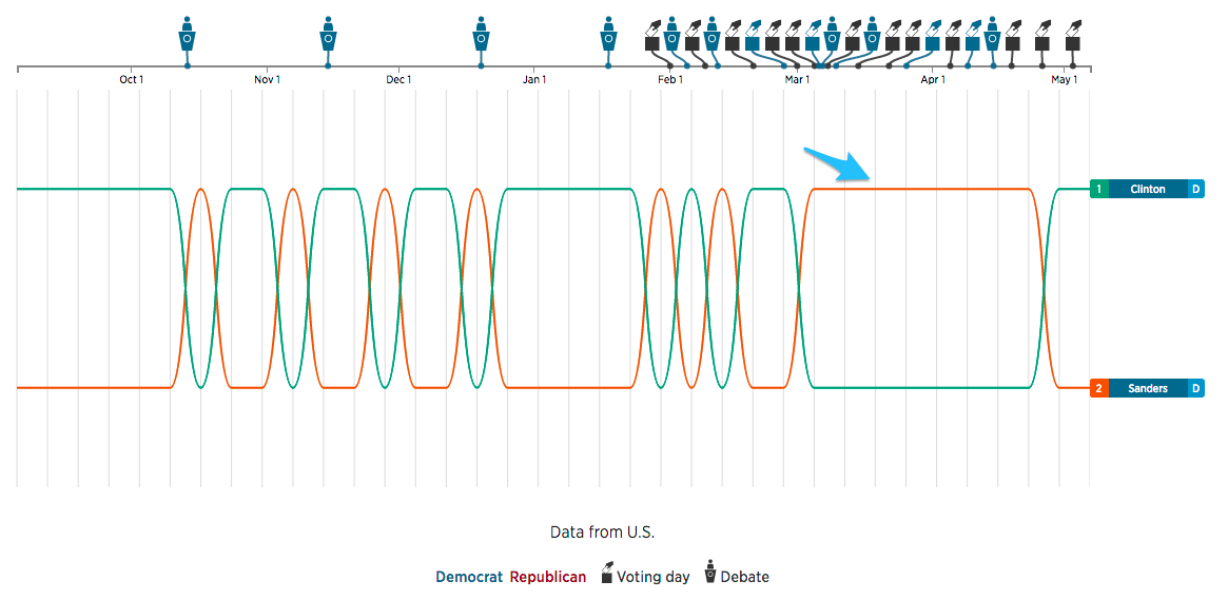
Super Tuesday was also when Sanders overtook Clinton in Twitter conversation which lasted for eight straight weeks until he lost four of five states on April 26.
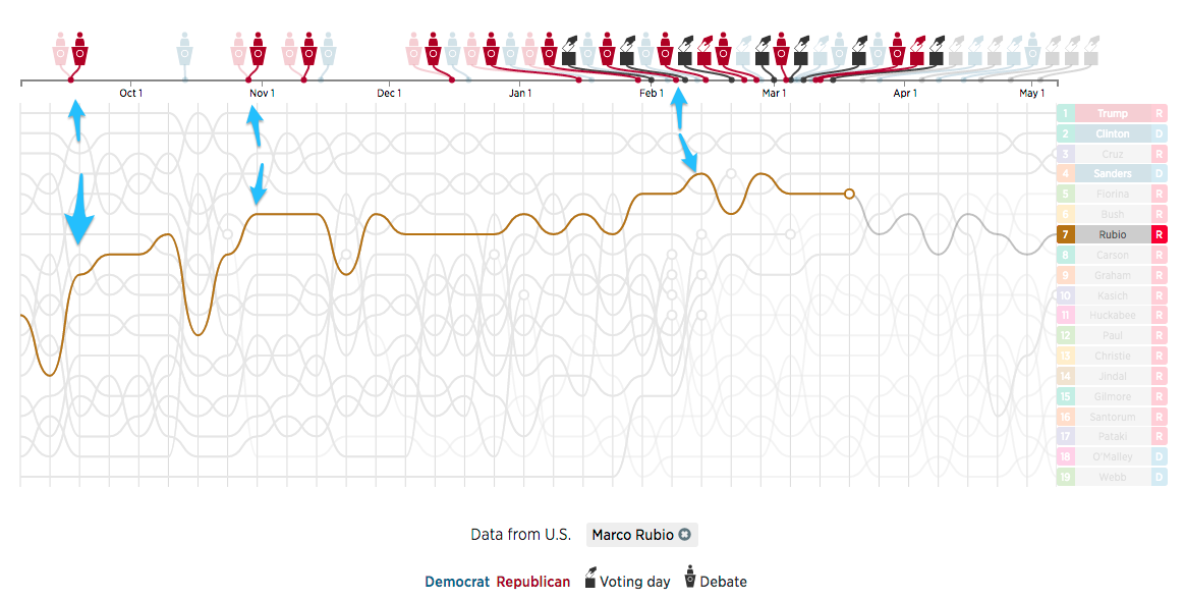
You can also explore a single candidate’s path throughout the campaign in-depth, and look for patterns of events that drove or shrank their place in the conversation.
Rubio gained momentum after almost every GOP debate before suspending his campaign:
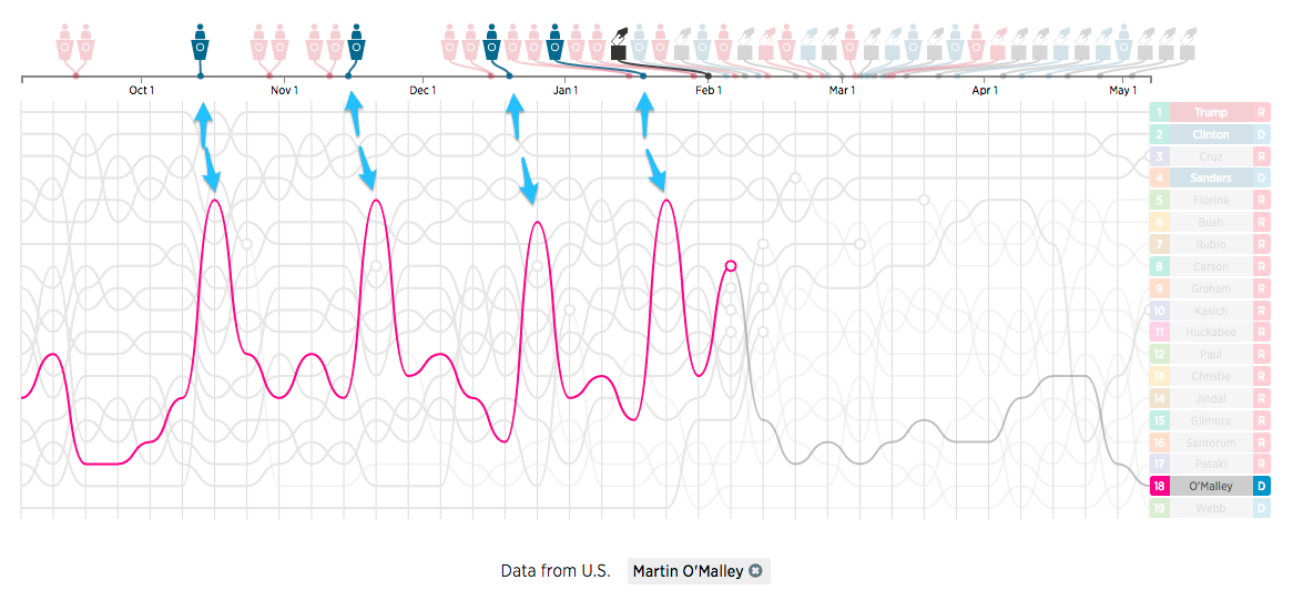
O’Malley also saw a surge in Twitter conversation around Democratic debates:
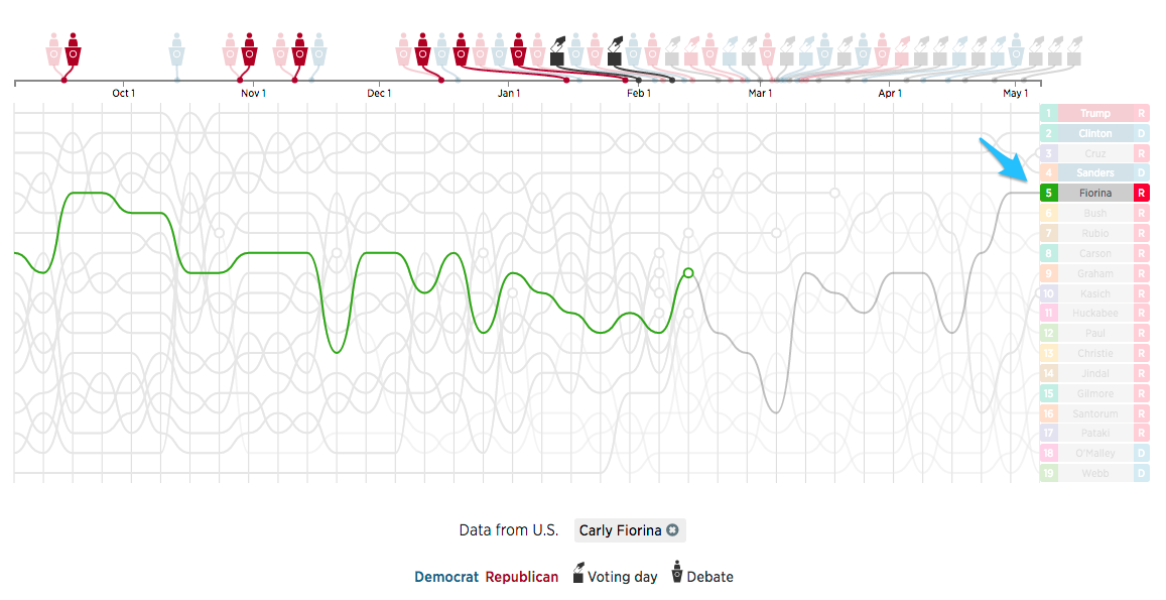
Leading up to her withdrawal from the race, Fiorina’s share of conversation was steadily decreasing. However, when Cruz announced her as his VP pick, interest picked up significantly — putting her into third place in the GOP (even besting presidential candidate Kasich).
Check out the full visualization here and press “Play” to see how the race has unfolded thus far!
Did someone say … cookies?
X and its partners use cookies to provide you with a better, safer and
faster service and to support our business. Some cookies are necessary to use
our services, improve our services, and make sure they work properly.
Show more about your choices.