
Visualizing your Twitter conversations
By
Tuesday, 15 July 2014
Pictures are an especially effective way to analyze relationships and conversations between Twitter users. To illustrate the power of Twitter data visualizations first-hand, this post details creating an interactive timeline based on when your friends started using Twitter.
For this example I’ll be using Node.js, vis.js and the Twitter REST API. (The full source code can be found on our GitHub page.) First, gather the user IDs of your friends using the friends/ids endpoint. I’ve removed error handling in the code below for simplicity.
function getFriends(next) {
  twitter.get('friends/ids', { screen_name: config.screen_name, count: 100 }, function(err, data) {
    lookupUsers(data.ids, next);
  });
}
Next call a function I’ve named lookupUsers, which returns fully-hydrated user objects when given user IDs. Only the user data necessary for display will be saved to an array, as seen below.
function lookupUsers(user_ids, next) {
  twitter.get('users/lookup', { user_id: user_ids.join() }, function(err, data) {

    var friends_array = new Array();
    for (index in data) {
      // Get your friend's join date and do some leading zero magic
      var date = new Date(data[index].created_at);
      var date_str = date.getFullYear() + '-'
                     + ('0' + (date.getMonth()+1)).slice(-2) + '-'
                     + ('0' + date.getDate()).slice(-2);

      // Push the info to an array
      friends_array.push({
        'name'          : data[index].name,
        'screen_name'   : data[index].screen_name,
        'created_at'    : date_str,
        'profile_image' : data[index].profile_image_url,
        'link_color'    : data[index].profile_link_color
      });
    }

    next(err, friends_array);
  });
}
That covers the only server-side code you’ll need. The friends_array is passed to an ejs template to render the HTML. The following loop outputs the user information to create a dataset. This dataset is used by vis.js to automatically render the interactive timeline.
var items = new vis.DataSet([
  <% for(var i=0; i<friends.length; i++) {%>
    {
      id: <%= i %>,
      start: '<%= friends[i].created_at %>',
      content: '<div class="user-image"><img src="<%= friends[i].profile_image %>" style="border-bottom: 3px solid #<%= friends[i].link_color %>;" /></div><div class="user-info"><b><%= friends[i].name %></b><br />@<%= friends[i].screen_name %></div>'
    }<% if (i != friends.length-1) {%>,<%}%>
  <% } %>
]);
Finally, run the server (node timeline.js) and point your browser to localhost:3000 to see your resulting visual timeline. It should look like the image below. Scroll in the timeline to zoom and drag to see users outside of the current view.
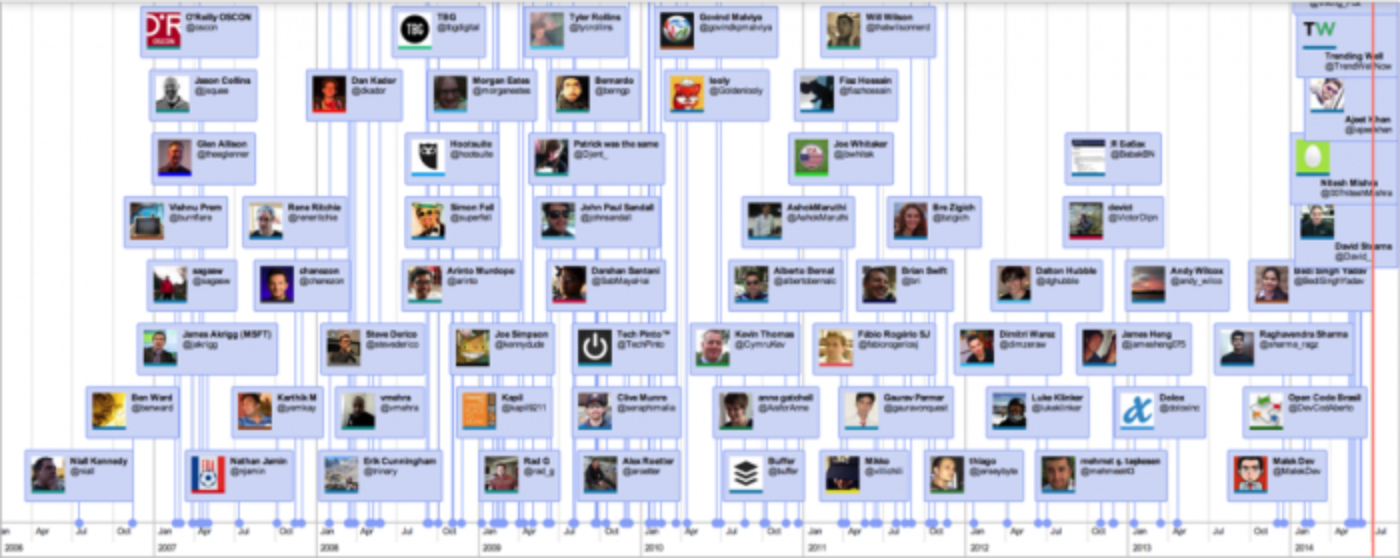
With only a few lines of code, you’ve just created a great visualization of your Twitter friends over time.
The visual representation of Twitter data such as this holds great potential, sometimes leading to simple “eye candy” while other other times surfacing valuable findings. Projects like this one enable the discovery of relationships, patterns and behaviors that would otherwise be difficult to observe. I would highly recommend this TEDEd talk by @blprnt as an example of this deeper discovery through data visualization.
Another great example of visualizing Twitter data is Mentionmapp, which uses the REST APIs to create an interactive map of your most frequent mentions and hashtags. You can explore your friends’ interests, expand your network and see which influencers interact with your brand.
Mentionmapp co-founder John Gray says, “Columns and rows are great for numbers. But for networks of people and their conversations we wanted to visually explore richer and more dynamic levels of connectivity. It’s way more engaging for our users.”
Building visualizations can help you to discover the unseen patterns and behaviors in your Twitter relationships. And from our how-to example above, you can also see that creating one can be relatively easy.
Now that you’ve implemented this sample, we challenge you to pick up our code on GitHub and further explore your own Twitter relationships and connections.
Did someone say … cookies?
X and its partners use cookies to provide you with a better, safer and
faster service and to support our business. Some cookies are necessary to use
our services, improve our services, and make sure they work properly.
Show more about your choices.