
Mobile app playbook: analytics and what to track
By
Wednesday, 9 March 2016
Last time, we talked about making constant, incremental improvements to your app, and testing out those changes. We covered how to run tests when you have a specific question in mind, but what about when you don’t? How do you know what’s important to monitor and keep track of all the time?
We find that there are three common use cases for app data: daily checks, investigations, and ad-hoc analysis.
The goal of the daily check is to make sure things are trending as expected. You may be paying attention to numbers like user growth, retention, or a stability rating related to the total number of crashes you’re observing. Looking at your top level metrics should give you an instant understanding of how your app is doing — so decide what matters and choose accordingly. For example, a task tracking app may be most concerned with getting people to visit every day, while a fitness app may care most about workouts completed, and having daily logins may not be a reasonable goal.
Daily checks should be quick and simple, taking no more than a few minutes of your time each day to confirm that everything looks as it should. When we built the Answers dashboard, we consulted app builders to see what they wanted in their daily check dashboard. You now see Monthly Active Users (MAU), Daily Active Users (DAU), crash-free users, and users in-app so you automatically have the “daily check” level information at a glance.
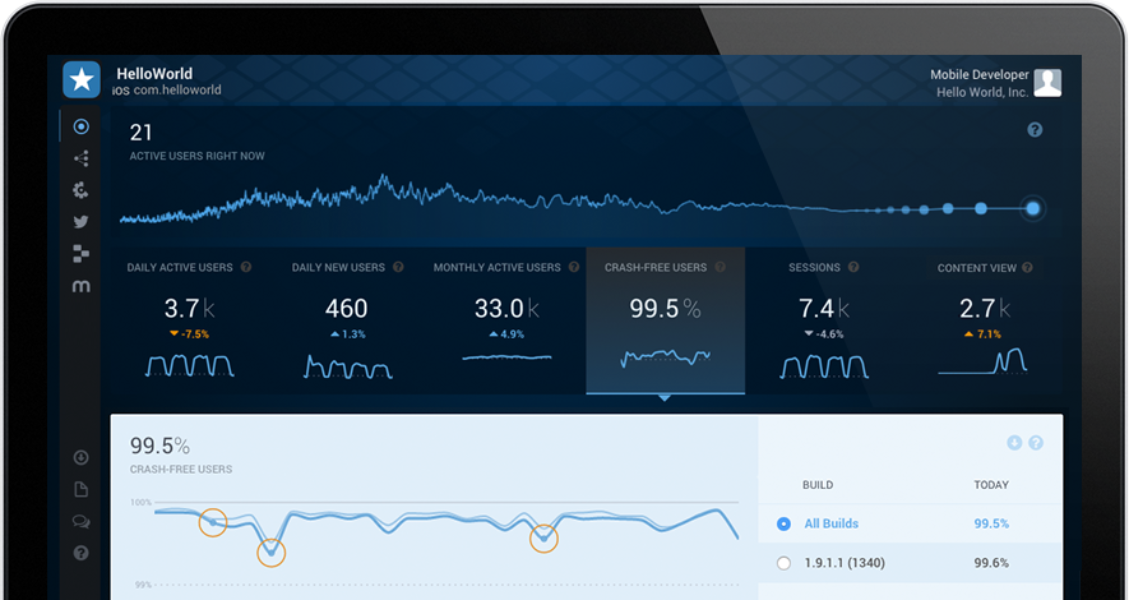 The Answers dashboard
With any luck, those key metrics will always be trending in a positive direction — but that’s not always the case. That’s when you need to dig deeper to figure out if the problem is a temporary anomaly, or a long-term trend that requires attention.
For instance, let’s say total workouts completed is down. This could be due to fewer people coming to the app overall, a smaller percentage of those people actually logging a workout, or people’s activity naturally taking a dip (e.g., during a blizzard). Your team’s intuition and customer knowledge will be key in coming up with any hypotheses.
When you’re trying to assess the root cause, segmenting the data in different ways can help you mathematically isolate the source of the deviation. In this case, we’d start with the simple case: is DAU down overall? If it’s not, we move on to the next hypothesis: is the ratio of workouts to users overall down? Once you find the probable source, dive into metadata: are there any commonalities (e.g., geolocation, network strength, user age group). Once you have a handle on the root cause, you can decide what needs to change, if anything.
Ad-hoc analysis is the process you go through to learn more about how people interact with a specific part of this app. It would answer questions like: How can I improve this flow? Why aren’t people purchasing as much as I’d like? If people complete a search, are they more likely to come back?
Doing this type of analysis usually requires having some interface to explore and segment the data. Top-level growth metrics (DAU, MAU, number of sessions) give you a surface-level idea of how things are going. But to make decisions about how to improve the app, you need to be able to segment your user base across multiple lines.
For example, you may assume that people who are in the app three times a week or more are getting more value out of it than people who only visit daily. If you want to find out what makes that group different, and how you can grow that group, you first need to be able to determine the unique characteristics of the group. Then you may want to add in-app events that will let you create different segments you think could be interesting. In our extended example, this may include:
So how do you pick the activities you should be tracking for later ad-hoc analysis? Typically, you want to consider user activities that define “success”: likes, shares, content views, purchases, and so on. You may also want to consider events that are more UX-driven: clicked this button, or adjusted this setting. UI events can be helpful information, but can also provide a lot of noise — be judicious about how many of these you track so you don’t get lost in the data.
And if you do feel lost in the data, remember that analytics are customer feedback at scale. If you can’t seem to get the initial hunch about what to track, or what might be affecting your top-line metrics, go and find some of your customers to talk to. Have an open-ended chat about how they use your app. Let them tell you — or show you — how they use it, what they like, what they don’t, and what confuses them. The better you understand your customers, the easier it will be to develop hunches and ideas about their behavior that you can test with analytics.
What tips do you have for understanding user behavior? Tweet at us with #MobileAppPlaybook to share!
And be sure to check out this new interview about Answers with Product Manager Brian Swift.
Did someone say … cookies?
X and its partners use cookies to provide you with a better, safer and
faster service and to support our business. Some cookies are necessary to use
our services, improve our services, and make sure they work properly.
Show more about your choices.