
Global Mobile Programmatic Trends Report: premium is the next phase of mobile programmatic
Thursday, 18 February 2016
We’re pleased to publish the latest Global Mobile Programmatic Trends Report, a quarterly update that takes an in-depth look at trends in monetization and ad performance across the mobile in-app programmatic ecosystem. The report reflects data from our MoPub Marketplace, a real-time bidding exchange that represents over 45,000 active mobile apps, more than 400 billion monthly ad requests, over one billion unique devices, and 175+ demand-side platforms.
You can download the full report or read on to get the highlights.
Premium is the next phase of mobile programmatic
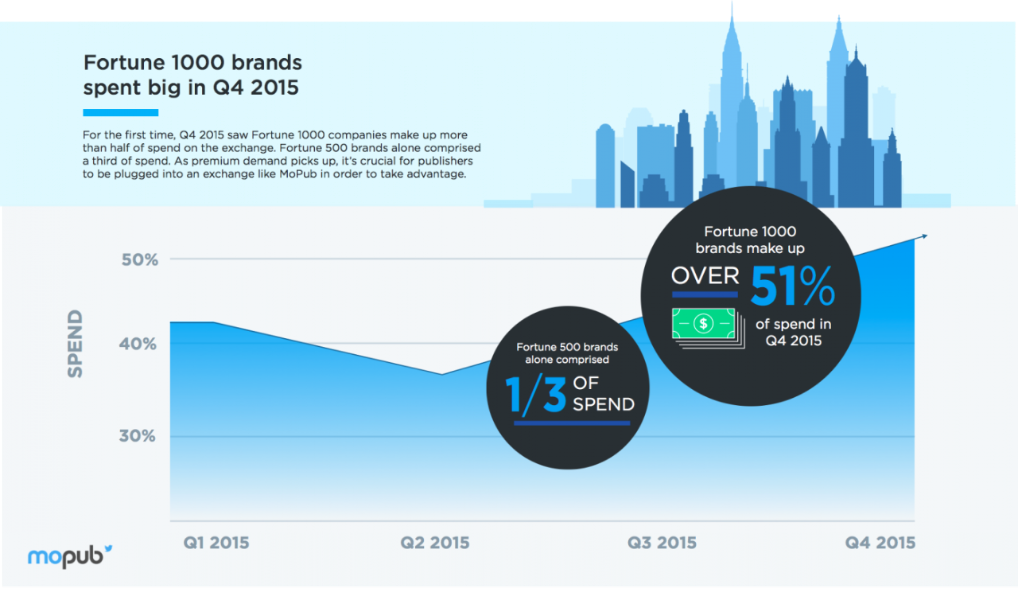
Looking at trends through 2015, marketers are valuing mobile in-app inventory more highly than ever. We saw major brand advertising campaigns grow in budget and scale across mobile apps throughout the year. This builds on the trend we saw leading into the holidays last year, when brand spend overtook performance for the first time on mobile programmatic. And in Q4 2015, for the first time, Fortune 1000 brands made up over 51% of ad spend for the entire quarter. Fortune 500 brands alone made up more than a third of spend.
Additionally, we found more inventory transacted through private marketplaces. Rather than going through the operational burden of selling their most valued supply through direct orders, many publishers opted to sell these impressions through private marketplaces to gain the efficiencies of a programmatic exchange. In Q4 2015, there were 30% more private marketplace deals which saw 165% more spend than just one quarter prior.
In tandem, we found publishers adopting engaging ad formats, such as video and native, to take advantage of growing demand for these high impact placements.
Engaging formats and inventory drive increases in demand and publisher monetization
Known for maintaining a strong user experience, native ads are increasingly being embraced by publishers — leading to a 385% increase in overall native supply in Q4 2015 vs. Q4 2014.
Click-through rates on native ads improved by 128% over this same time period — perhaps spurring the strong demand growth we saw with 76% more DSPs buying native ads.
Buyers also increased adoption of video — the ad format where we see the highest click-through rates. Twice as many DSPs bought video ads in Q4 2015 vs. the same time period a year prior. This increased competition benefitted publishers in a major way, with 55% higher eCPMs and more than double the revenue from video ad inventory.
Across all ad formats and sizes, MoPub Marketplace saw 107% higher spend in Q4 2015 compared to Q4 2014, driven in part by 115% more advertisers buying through the exchange.
Major trends repeated themselves in key global regions
Publisher revenue and supply increased in APAC and EMEA over the course of 2015, underscored by major growth and demand investment in native and video.
While APAC inventory grew overall by 155% in Q4 2015 vs. Q4 2014, a big portion of this growth was driven by increases in native (+1,184%) and video (+114%) during the same period. On a similar front, EMEA inventory grew overall by 45% in Q4 2015 vs. Q4 2014 — with a driving force from native (+138%) and video (+107%) in that same timeframe.
Buyers benefited from higher user engagement with these formats, too. Between Q4 2014 and Q4 2015, click-through rates increased on both native (APAC: +131%; EMEA: +104%) and video (APAC: +56%; EMEA: +58%).
You can read the full Q4 2015 report to see all of the trends we found in mobile programmatic advertising. Follow @MoPub on Twitter for more updates like this.
The data reflected here is solely representative of quarterly trends from exchange-traded media; it does not include any ad network or ad network mediation data. MoPub does not sell advertising and does not buy inventory. The data includes quarter-over-quarter and year-over-year trends across several dimensions that impact revenue for mobile application publishers.
Also please note that the general findings here are based on internal data and data from a third party, and may be subject to errors and omissions. Each ad campaign is different.
Have questions or want more details? Email MoPub-datareports@twitter.com and we’ll be in touch.
Did someone say … cookies?
X and its partners use cookies to provide you with a better, safer and
faster service and to support our business. Some cookies are necessary to use
our services, improve our services, and make sure they work properly.
Show more about your choices.