
Braindump
By
Monday, 28 January 2013
For various reasons, including performance and cost, Twitter has poured significant engineering effort into breaking down the site backend into smaller JVM based services. As a nice side effect we’ve been able to open source several of the libraries and other useful tools that came out of this effort.
While there is a fair amount of information about these projects available as docs or slides I found no simple, high level introduction to what we can unofficially call the Twitter stack. So here it is. It’s worth noting that all this information is about open source projects, that it is public already and that I am not writing this as part of my job at Twitter or on their behalf.
Now, granted these were not all conceived at Twitter and plenty of other companies have similar solutions. However I think the software mentioned below is quite powerful and with most of it released as open source it is a fairly compelling platform to base new services off of.
I will describe the projects from a Scala perspective, but quite a few are useful in Java programs as well. See the Twitter Scala school for an intro to the language, although that is not required to understand this post.
At the heart of a service lies the Finagle library. By abstracting away the fundamental underpinnings of an RPC system, Finagle greatly reduces the complexity that service developers have to deal with. It allows us to focus on writing application-specific business logic instead of dwelling on lower level details of distributed systems. Ultimately the website itself uses these services to perform operations or fetch data needed to render the HTML. At Twitter the internal services use the Thrift protocol, but Finagle supports other protocols too such as Protocol buffers and HTTP.
Setting up a service using Finagle
A quick dive into how you would set up a Thrift service using Finagle.
That looks pretty similar to just using plain Thrift without Finagle. However, there are quite a few improvements such as excellent monitoring support, tracing and Finagle makes it easy to write your service in an asynchronous fashion. More about these features later.
You can also use Finagle as a client. It takes care of all the boring stuff such as timeouts, retries and load balancing for you.
So let’s say we have a Finagle Thrift service running. It’s doing very important work. Obviously you want to make sure it keeps doing that work and that it performs well. This is where Ostrich comes in.
Metrics
Ostrich makes it easy to expose various metrics from your service. Let’s say you want to count how many times a particular piece of code is run. In your service you’d write a line of code that looks something like this:Stats.incr(“some_important_counter”)
As simple as that. The counter named some_important_counter will be incremented by 1.
In addition to just straight up counters you can get gauges that report on the value of a variable:Stats.addGauge("current_temperature") { myThermometer.temperature }
or you can time a snippet of code to track the performanceStats.time("translation") {
document.translate("de", "en")
}
Those and other examples can be found in the Ostrich readme.
Export metrics
Ostrich runs a small http admin interface to expose these metrics and other functionality. To fetch them you would simply hit http://hostname:port/stats.json to get the current snapshot of the metrics as JSON. At Twitter the stats from each service will be ingested from Ostrich by our internal observability stack, providing us with fancy graphs, alerting and so on.
To tie this back to our previous section: If you provide a Finagle client or server builder with an Ostrich backed StatsReceiver it’ll happily splurt out tons of metrics about how the service is performing, the latencies for the RPC calls and the number of calls to each method to name a few.
Ostrich can also deal with configuring your service, shutting down all the components gracefully and more.
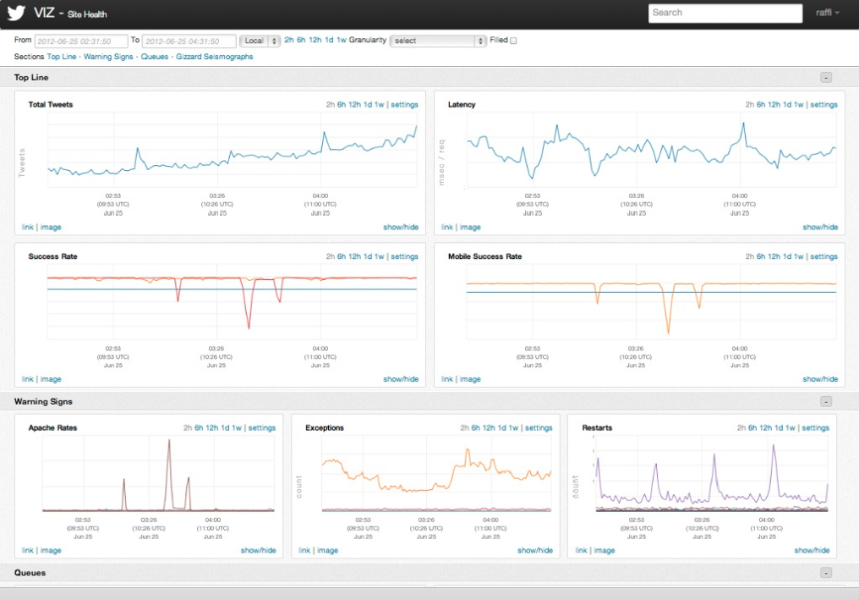
This is an example of what a dashboard could look like with stats gathered from Ostrich by our observability stack. Screenshot from @raffi’s presentation deck.
Ostrich and Finagle combined gives us good service level metrics. However, one downside of a more service oriented architecture is that it’s hard to get a high level performance overview of a single request throughout the stack.
Perhaps you are a developer tasked with improving performance of a particular external api endpoint. With Zipkin you can get a visual representation of where most of the time to fulfill the request was spent. Think Firebug or Chrome developer tools for the back end. Zipkin is a implementation of a tracing system based off of the Google Dapper paper.
Finagle-Zipkin
So how does it work? There’s a finagle-zipkin module that will hook into the transmission logic of Finagle and time each operation performed by the service. It also passes request identifiers down to any services it relies on, this is how we can tie all the tracing data together. The tracing data is logged to the Zipkin backend and finally we can display and visualize that data in the Zipkin UI.
Let’s say we use Zipkin to inspect a request and we see that it spent most of it’s time waiting for a query to a MySQL database. We could then also see the actual SQL query sent and draw some conclusions from it. Other times perhaps a GC in a Scala service was a fault. Either way, the hope is that a glance at the trace view will reveal where the developer should spend effort improving performance.
Enabling tracing for Finagle services is often as simple as adding
.tracerFactory(ZipkinTracer())
to your ClientBuilder or ServerBuilder. Setting up the whole Zipkin stack is a bit more work though, check out the docs for further assistance.
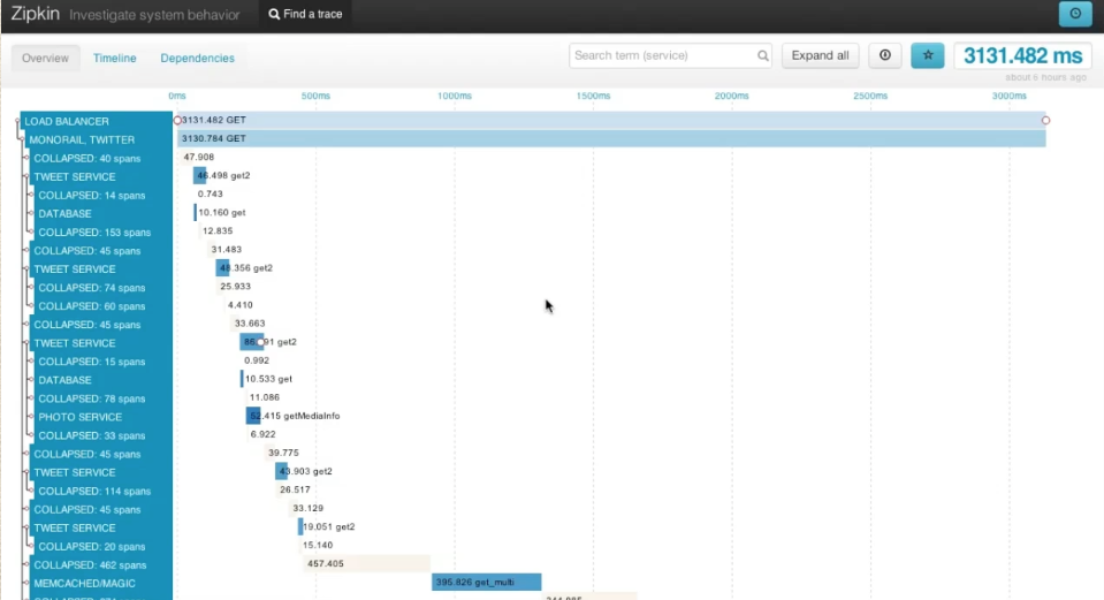
Trace view, taken from my Strange loop talk about Zipkin.
Mesos describes itself as “a cluster manager that provides efficient resource isolation and sharing across distributed applications, or frameworks”. I’ll try to go through this section without using buzzwords such as “private cloud”, although technically I just did.
The core Mesos project is an open source Apache incubator project. On top of it you can run schedulers that deal with more specific technologies, for example Storm and Hadoop. The idea being that the same hardware can be used for multiple purposes, reducing wasted resources.
In addition to using Storm on top of Mesos we deploy some of our JVM-based services to internal Mesos clusters. With the proper configuration it takes care of concerns such as rack diversity, rescheduling if a machine goes down and so on.
The constraints imposed by Mesos have the positive side effect of enforcing adherence to various good distributed systems practices. For example:
Before putting your new service into production you might want to check how it performs under load. That’s where Iago (formerly Parrot) comes in handy. It’s a load testing framework that is pretty easy to use.
The process might look something like this:
Example
A load test class could be as simple as this:class LoadTest(parrotService: ParrotService[ParrotRequest, Array[Byte]]) extends
ThriftRecordProcessor(parrotService) {
val client = new YourService.FinagledClient(service, new TBinaryProtocol.Factory())
def processLines(job: ParrotJob, lines: Seq[String]) {
lines foreach {line =>client.doSomething(line) }
}
}
This class will feed each log line to your service’s doSomething method, according to the parameters defined in the configuration of parrotService.
ZooKeeper is an Apache project that is handy for all kinds of distributed systems coordination.
One use case for ZooKeeper within Twitter is service discovery. Finagle services register themselves in ZooKeeper using our ServerSet library, see finagle-serversets. This allows clients to simply say they’d like to communicate with “the production cluster for service a in data centre b” and the ServerSet implementation will ensure an up-to-date host list is available. Whenever new capacity is added the client will automatically be aware and will start load balancing across all servers.
From the Scalding github page: “Scalding is a Scala library that makes it easy to write MapReduce jobs in Hadoop. Instead of forcing you to write raw map and reduce functions, Scalding allows you to write code that looks like natural Scala”.
As it turns out services that receive a lot of traffic generate tons of log entries. These can provide useful insights into user behavior or perhaps you need to transform them to be suitable as Iago load test input.
I have to admit I was a bit sceptical about Scalding at first. It seemed there were already plenty of ways to write Hadoop jobs. Pig, Hive, plain MapReduce, Cascading and so on. However, when the rest of your project is in Scala it is very handy to be able to write Hadoop jobs in the same language. The syntax is often very close to the one used by Scala’s collection library, so you feel right at home, the difference being that with Scalding you might process terabytes of data with the same lines of code.
A simple word count example from their tutorial:
TextLine(args("input"))
    .read
    .flatMap('line -> 'word){ line : String => line.split("\\s")}
    .groupBy('word){group => group.size}
    .write(Tsv(args("output")))
One of the well known downsides of relying on the JVM for time sensitive requests is that garbage collection pauses could ruin your day. If you’re unlucky a GC pause might hit at the wrong time, causing some requests to perform poorly or even timeout. Worst case that might have knock on effects that leads to downtime.
As a first line of defence against GC issues you should of course tweak your JVM startup parameters to suit the kind of work the service is undertaking. I’ve found these slides from Twitter alumni Attila Szegedi extremely helpful.
Of course, you could minimize GC issues by reducing the amount of garbage your service generates. Start your service with jvmgcprof and it’ll help you reach that goal. If you already use Ostrich to track metrics in your service you can tell jvmgcprof which metric represents the work completed. For example you might want to know how many kilobytes of garbage is generated per incoming Thrift request. The jvmgcprof output for that could look something like this.
2797MB w=101223 (231MB/s 28kB/w)
50.00% 8 297
90.00% 14 542
95.00% 15 572
99.00% 61 2237
99.90% 2620 94821
99.99% 2652 95974
On the first line you can see that the number requests or work were 101223 for the period monitored, with 231MB/s of garbage or 28kB per request. The garbage per request can easily be compared after changes has been made to see if they had a positive or negative impact on garbage generation. See the jvmgcprof readme for more information.
It’s no surprise, but it turns out that having a common stack is very beneficial. Improvements and bug fixes made by one team will benefit others. There is of course another side to that coin, sometimes bugs are introduced that might just be triggered in your service. However, as an example, when developing Zipkin it was immensely helpful to be able to assume that everyone used Finagle. That way they would get tracing for free once we were done.
I have left out some of the benefits of the Twitter stack and how we use Scala, such as the very convenient way Futures allow you to deal with results from asynchronous requests. I hope to write a more in depth post on how to set up a Twitter style service that would deal with the details omitted in this article. In the meantime you can check out the Scala school for more information.
Thanks to everyone who worked on the projects mentioned in this article, too many to name but you know who you are.
Posted by Johan Oskarsson
Did someone say … cookies?
X and its partners use cookies to provide you with a better, safer and
faster service and to support our business. Some cookies are necessary to use
our services, improve our services, and make sure they work properly.
Show more about your choices.