
Observability at Twitter
Monday, 9 September 2013
As Twitter has moved from a monolithic to a distributed architecture, our scalability has increased dramatically.
Because of this, the overall complexity of systems and their interactions has also escalated. This decomposition has led to Twitter managing hundreds of services across our datacenters. Visibility into the health and performance of our diverse service topology has become an important driver for quickly determining the root cause of issues, as well as increasing Twitter’s overall reliability and efficiency. Debugging a complex program might involve instrumenting certain code paths or running special utilities; similarly Twitter needs a way to perform this sort of debugging for its distributed systems.
One important metric we track is the overall success rate of the Twitter API. When problems arise, determining the cause requires a system capable of handling metrics from our heterogenous service stack. To understand the health and performance of our services, many things need to be considered together: operating systems, in-house and open-source JVM-based applications, core libraries such as Finagle, storage dependencies such as caches and databases, and finally, application-level metrics.
Engineers at Twitter need to determine the performance characteristics of their services, the impact on upstream and downstream services, and get notified when services are not operating as expected. It is the Observability team’s mission to analyze such problems with our unified platform for collecting, storing, and presenting metrics. Creating a system to handle this job at Twitter scale is really difficult. Below, we explain how we capture, store, query, visualize and automate this entire process.
Architecture
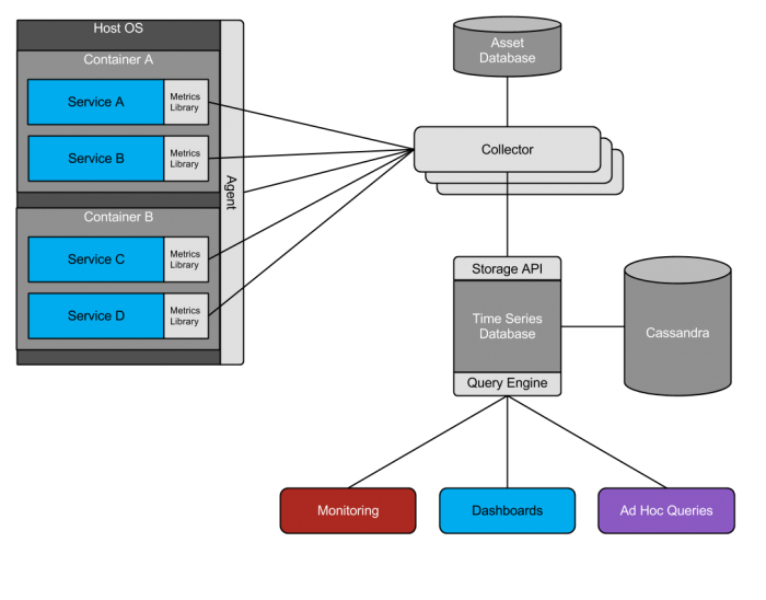
Collection
A key component to allowing performant yet very fine grained instrumentation of code and machines is to optimize for the lowest cost aggregation and rollup possible. This aggregation is is generally implemented via in-memory counters and approximate histograms in a service or application memory space, and then exported to the Observability stack over a consistent interface. Such metrics are collected from tens of thousands of endpoints representing approximately 170 million individual metrics every minute. In the vast majority of cases, data is pulled by the Observability stack from endpoints, however a hybrid aggregation and application-push model is used for specific applications which cannot or do not provide in-memory rollups.
An endpoint is generally an HTTP server which serves a consistent view of all metrics it exports. For our applications and services, these metrics are exported by in-JVM stats libraries — such as the open-source Twitter-Server framework — which provide convenient functions for adding instrumentation. Depending on the level of instrumentation and which internal libraries are used (such as Finagle, which exports rich datasets), applications commonly export anywhere from 50 to over 10,000 individual metrics per instance.
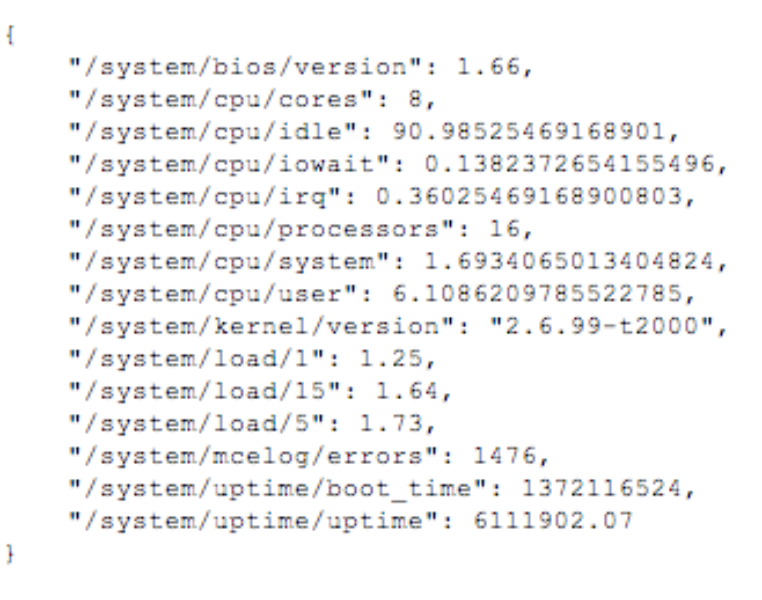
For applications and metrics which do not use our core common libraries, data is made available via a host-agent over the same HTTP interface. This includes machine and operating system statistics, such as disk health, CPU, memory, and overall network traffic.
All metrics are identified by multiple dimensions, including an underlying service name, and the origin of the data: such as a host, dynamically scheduled application instance identifier, or other identifier specific to the service, and a metric name. Numeric metrics are written to a time series database, which we will cover in more detail in the next section. For batch-processing and non-numeric values, the data is routed to HDFS using Scribe. Scalding and Pig jobs can be run to produce reports for situations that are not time-sensitive.
Determining the network location of applications running in a multi-tenant scheduled environment such as Mesos adds additional complexity to metric collection when compared to ones deployed on statically allocated hosts. Applications running in Mesos may be co-located with other applications and are dynamically assigned network addresses, so we leverage Zookeeper to provide dynamic service discovery in order to determine where an application is running. This data is centralized for use in collector configurations and is queried around 15,000 times per minute by users and automated systems.
In some cases, the default collection period is insufficient for surfacing emergent application behavior. To supplement the existing pipeline, Observability also supports a self-service feature to collect data at a user-specified interval, down to one second, and serve it from an ephemeral store. This enables engineers to focus on key metrics during an application deployment or other event where resolution is important but durability and long term storage are less critical.
Storage
Collected metrics are stored in and queried from a time series database developed at Twitter. As the quantity and dimension of time series data for low-latency monitoring at Twitter grew, existing solutions were no longer able to provide the features or performance required. As such, the Observability team developed a time series storage and query service which served as the abstraction layer for a multitude of Observability products. The database is responsible for filtering, validating, aggregating, and reliably writing the collected metrics to durable storage clusters, as well as hosting the query interface.
There are separate online clusters for different data sets: application and operating system metrics, performance critical write-time aggregates, long term archives, and temporal indexes. A typical production instance of the time series database is based on four distinct Cassandra clusters, each responsible for a different dimension (real-time, historical, aggregate, index) due to different performance constraints. These clusters are amongst the largest Cassandra clusters deployed in production today and account for over 500 million individual metric writes per minute. Archival data is stored at a lower resolution for trending and long term analysis, whereas higher resolution data is periodically expired. Aggregation is generally performed at write-time to avoid extra storage operations for metrics that are expected to be immediately consumed. Indexing occurs along several dimensions–service, source, and metric names–to give users some flexibility in finding relevant data.
Query Language
An important characteristic of any database is the ability to locate relevant information. For Observability, query functionality is exposed as a service by our time series database over HTTP and Thrift. Queries are written using a declarative, functional inspired language. The language allows for cross-correlation of multiple metrics from multiple sources across multiple databases spread across geographical boundaries. Using this query interface and language provide a unified interface to time series data that all processing and visualization tools at Twitter use. This consistency means a single technology for engineers to learn to debug, visualize and alert on performance data.
Example Queries
Show the slow query count summed for all machines in the role. This can be used in CLI tools or visualizations. The arguments are aggregate function, service name, sources and metric name:
![]()
Metrics can also be correlated; for instance, the percentage of queries which were slow:
![]() Alerts use the same language. The first value is for warning and second is for critical. 7 of 10 minutes means the value exceeded either threshold for any 7 minutes out of a 10 minute window. Note it is identical to the earlier query except for the addition of a threshold and time window:
Alerts use the same language. The first value is for warning and second is for critical. 7 of 10 minutes means the value exceeded either threshold for any 7 minutes out of a 10 minute window. Note it is identical to the earlier query except for the addition of a threshold and time window:
![]()
On average, the Observability stack processes 400,000 queries per minute between ad-hoc user requests, dashboards and monitoring. The vast majority of these queries come from the monitoring system.
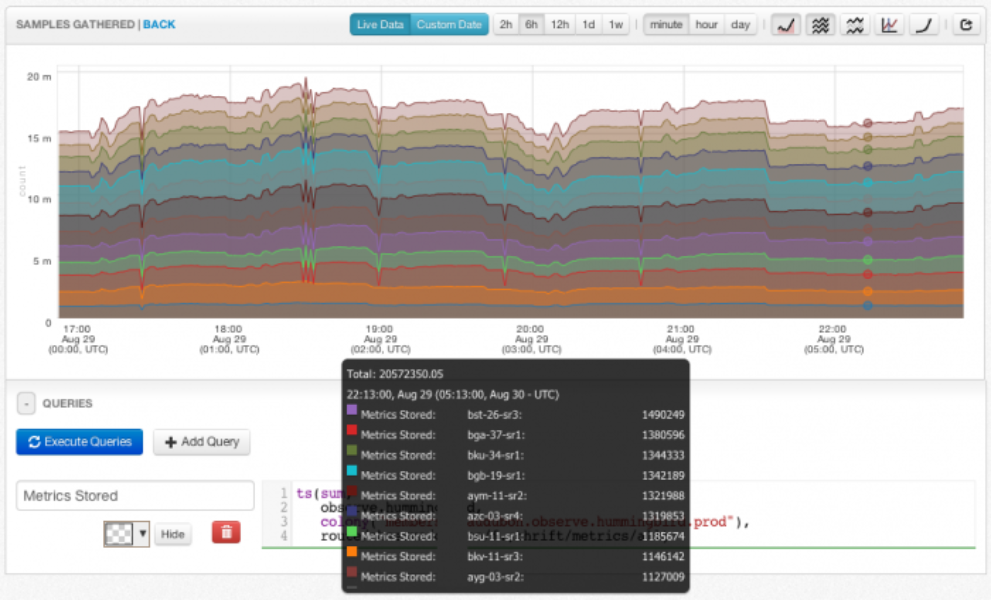
Visualization
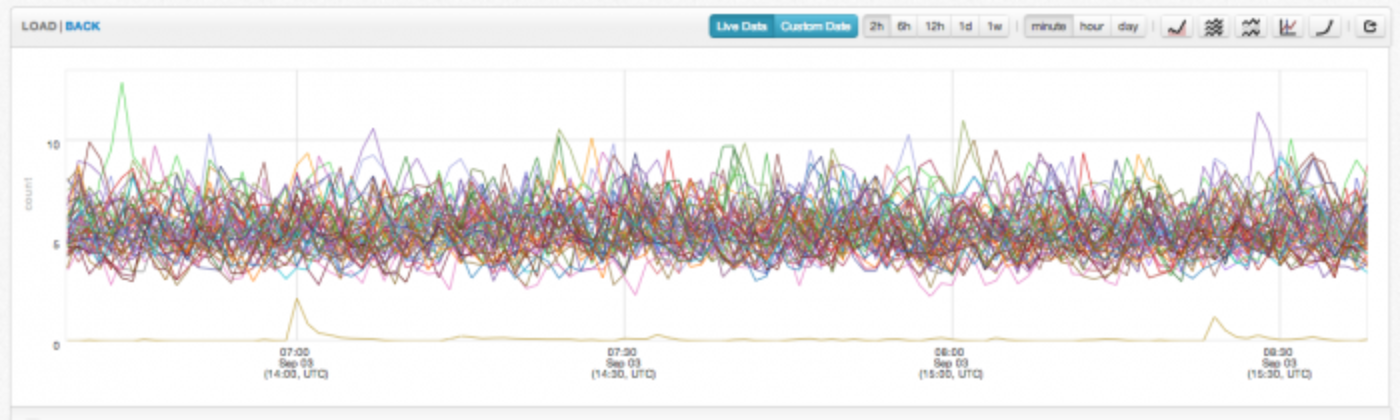
While collecting and storing the data is important, it is of no use to our engineers unless it is visualized in a way that can immediately tell a relevant story. Engineers use the unified query language to retrieve and plot time series data on charts using a web application called Viz. A chart is the most basic visualization unit in Observability products. Charts are often created ad hoc in order to quickly share information within a team during a deploy or an incident, but they can also be created and saved in dashboards. A command line tool for dashboard creation, libraries of reusable components for common metrics, and an API for automation are available to engineers.
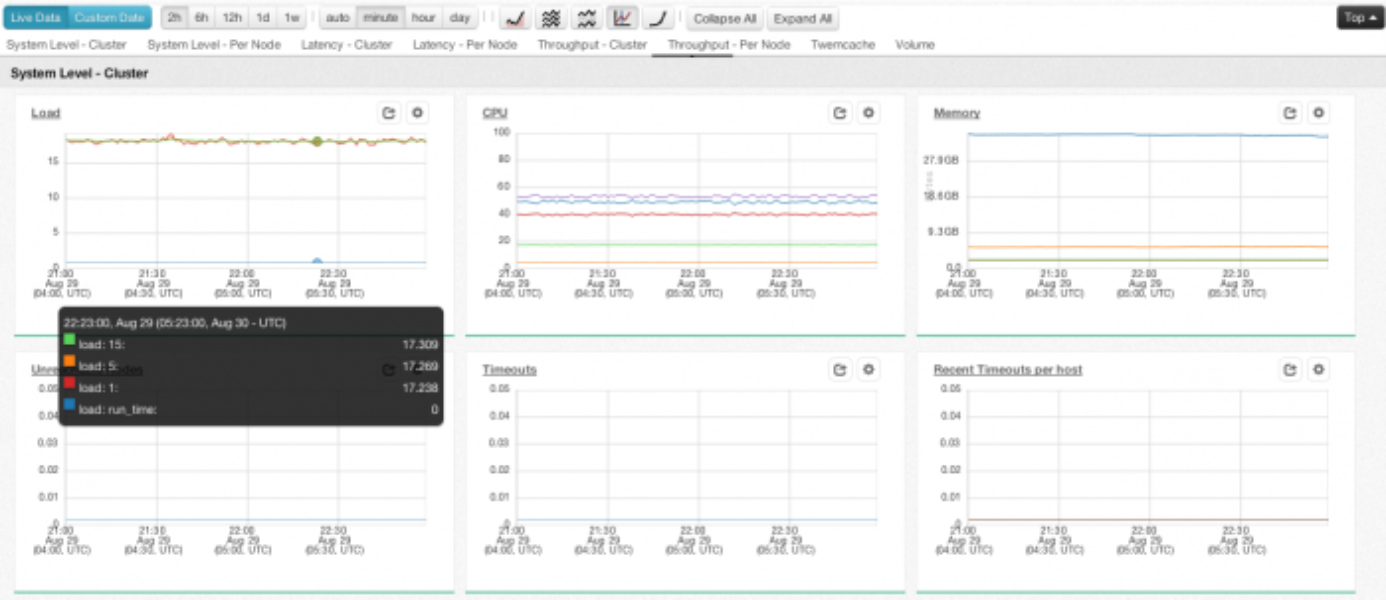
Dashboards are equipped with many tools to help engineers analyze the data. They can toggle between chart types (stacked and/or filled), chart scales (linear or logarithmic), and intervals (per-minute, per-hour, per-day). Additionally, they can choose between live near real-time data and historical data dating back to the beginning of when the service began collection. The average dashboard at Twitter contains 47 charts. It’s common to see these dashboards on big screens or on engineer’s monitors if you stroll through the offices. Engineers at Twitter live in these dashboards!
Visualization use cases include hundreds of charts per dashboard and thousands of data points per chart. To provide the required chart performance, an in-house charting library was developed.
Monitoring
Our monitoring system allows users to define alert conditions and notifications in the same query language they use for ad hoc queries and building dashboards. The addition of a predicate (e.g. > 50 for 20 minutes) to a query expresses the condition the user wants to be notified about. The evaluation of these queries is partitioned across multiple boxes for scalability and redundancy with failover in the case of node failure. This system evaluates over 10,000 queries each minute across Twitter’s data centers. Notifications are sent out via email, voice call, or text message.
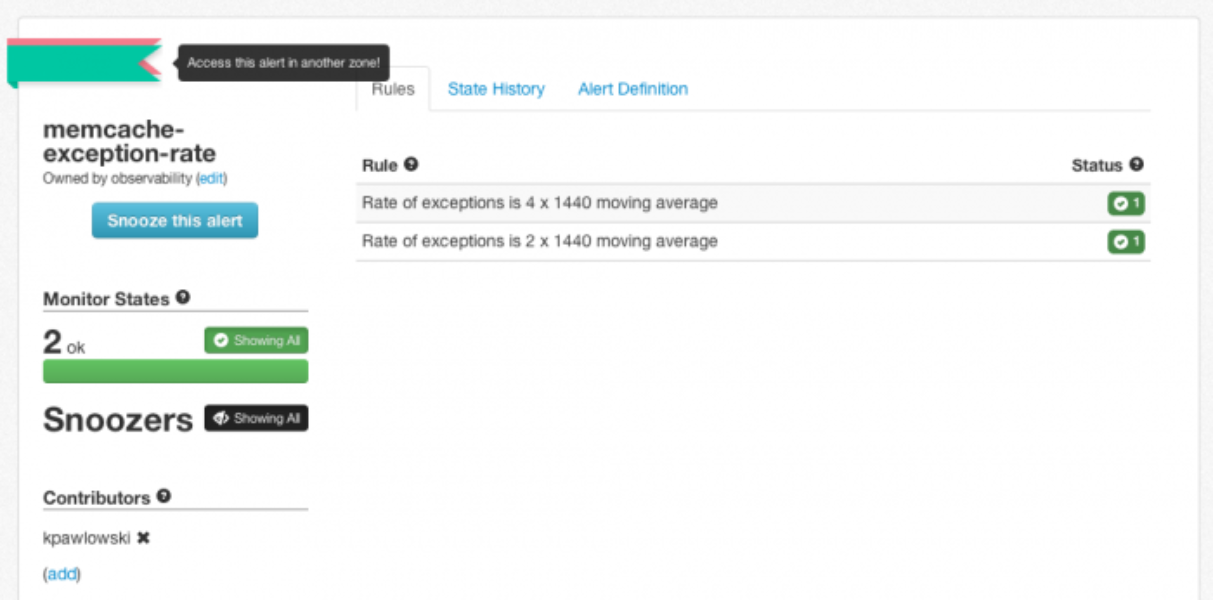
The monitoring system also provides an API that is used to create a rich UI for teams to actively monitor the state of their service. Users can view the historical metrics for an alert as well as snooze an alert, specific rules, or specific machines during maintenance.
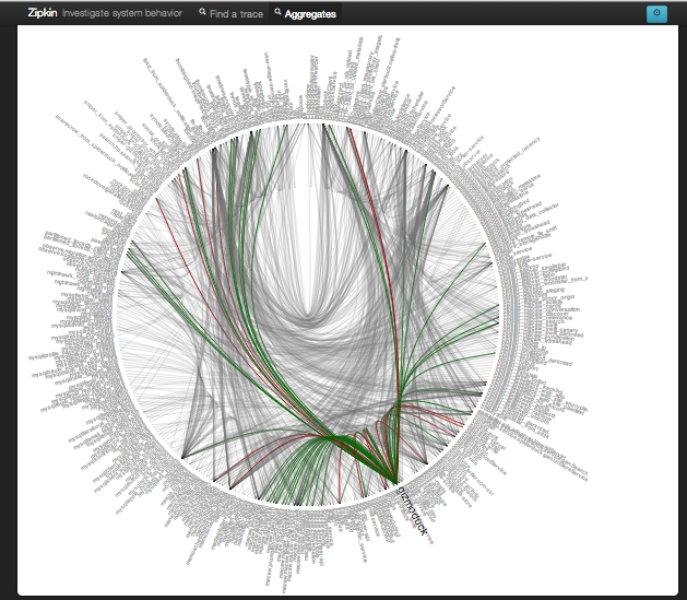
Related Systems
In addition to conventional per-minute metric data, we have two other significant internal systems for learning about the health and performance of services. Zipkin, our distributed tracing system, does not contribute to monitoring but is integral in many debugging situations. Finally, an in-house exception logging and reporting application is an important tool for investigating the health of many systems and is often the first thing checked when Twitter’s success rate fluctuates.
Future Work
Twitter’s Observability stack is a distributed system just like the systems it provides visibility into. About 1.5% of the machines in a data center are used for collection, storage, query processing, visualization, and monitoring (0.3% if storage is excluded). It is common to see a dashboard or chart open within Twitter’s engineering areas. Our charts update as new data is available and many charts contain multiple queries. We serve around 200 million queries a day that end up in charts. This gives our engineers access to a huge amount of data for diagnosing, monitoring or just checking on health.
This architecture has enabled us to keep up with the breakneck pace of growth and the tremendous scale of Twitter. Our challenges are not over. As Twitter continues to grow, it is becoming more complex and services are becoming more numerous. Thousands of service instances with millions of data points require high performance visualizations and automation for intelligently surfacing interesting or anomalous signals to the user. We seek to continually improve the stability and efficiency of our stack while giving users more flexible ways of interacting with the entire corpus of data that Observability manages.
These are some of the complex problems that are being solved at Twitter. It is our hope that we have provided a thorough overview of the problems faced when monitoring distributed systems and how Twitter works to solve them. In future posts, we’ll dive deeper into parts of the stack to give more technical detail and discussion of the implementations. We’ll also discuss ways the system can be improved and what we are doing to make that happen.
Acknowledgements
The entire Observability team contributed to creating this overview: Charles Aylward (@charmoto), Brian Degenhardt (@bmdhacks), Micheal Benedict (@micheal), Zhigang Chen (@zhigangc), Jonathan Cao (@jonathancao), Stephanie Guo (@stephanieguo), Franklin Hu (@thisisfranklin), Megan Kanne (@megankanne), Justin Nguyen (@JustANguyen), Ryan O’Neill (@rynonl), Steven Parkes (@smparkes), Kamil Pawlowski (@oo00o0o00oo), Krishnan Raman (@dxbydt_jasq), Yann Ramin (@theatrus), Nik Shkrob (@nshkrob), Daniel Sotolongo (@sortalongo), Chang Su (@changsmi), Michael Suzuki (@michaelsuzuki), Tung Vo (@tungv0), Daniel Wang, Cory Watson (@gphat), Alex Yarmula (@twalex), and Jennifer Yip (@lunchbag).
Did someone say … cookies?
X and its partners use cookies to provide you with a better, safer and
faster service and to support our business. Some cookies are necessary to use
our services, improve our services, and make sure they work properly.
Show more about your choices.