Infrastructure
Improving key expiration in Redis
By
Friday, 12 April 2019
Recently, we had an interesting issue where we ran into some performance issues in our Redis clusters. After a lot of time spent debugging and testing we were able to reduce Redis’s memory use in some of our clusters by up to 25% with changes to key expiration.
Internally Twitter runs multiple cache services. One of them is backed by Redis. Our Redis clusters store data for some Twitter’s most important use cases such as impression and engagement data, ad spend counting, and Direct Messages.
Background Info and the Problem
Back in early 2016 Twitter’s Cache team did a large update to the architecture of our Redis clusters. A few things changed, among them was an update from Redis version 2.4 to version 3.2. After this update a couple issues came up. Users started to see memory use that didn’t align with what they expected or were provisioned to use, latency increases and key evictions. The key evictions were a big problem because data was removed that was expected to be persistent or traffic was now going to origin data stores that originally wasn’t.
Initial Investigation
The teams affected along with the cache team started to investigate. We found that the latency increase was related to the key evictions that were now happening. When Redis receives a write request but doesn’t have memory to save the write, it will stop what it is doing, evict a key then save the new key. We still needed to find where the increase in memory usage was happening that was causing these new evictions.
We suspected that memory was full of keys that were expired but haven’t been deleted yet. One idea someone suggested was to use a scan, which would read all of the keys, causing expired ones to be deleted.
In Redis there are two ways keys can be expired, actively and passively. Scan would trigger passive key expiration, when the key is read the TTL will be checked and if it is expired throw it away and return nothing. Active key expiration in version 3.2 is described in the Redis documentation. It starts with a function called activeExpireCycle. It runs on an internal timer Redis refers to as cron, that runs several times a second. What this function does is cycle through each keyspace, check random keys that have a TTL set, and if a percentage threshold was met of expired keys, repeat this process until a time limit is met.
This idea of scanning all keys worked, memory use dropped when a scan completed. It seemed that Redis wasn’t efficiently expiring keys any more. Unfortunately, the resolution at the time was to increase the size of the cluster and more hardware so keys would be spread around more and there would be more memory available. This was disappointing because the project to upgrade Redis mentioned earlier reduced the size and cost of running these clusters by making them more efficient.
Redis versions: What changed?
Between version 2.4 and 3.2 the implementation for activeExpireCycle changed. In 2.4 every database was checked each time it ran, in 3.2 there is now a maximum to how many databases can be checked. Version 3.2 also introduced a fast option to the function. “Slow” runs on the timer and “fast” runs before checking for events on the event loop. Fast expiration cycles will return early under certain conditions and it also has a lower threshold for the function to timeout and exit. The time limit is also checked more frequently. Overall 100 lines of code were added to this function.
Returning to the Investigation
Recently we had time to go back and revisit this memory use issue. We wanted to explore why there was a regression and then see how we could make key expiration better. Our first theory was that with so many keys in an instance of Redis sampling 20 wasn’t enough. The other thing we wanted to investigate was the impact of the database limit introduced in 3.2.
Scale and the the way sharding is handled makes running Redis at Twitter unique. We have large keyspaces with millions of keys. This isn’t typical for users of Redis. Shards are represented by a keyspace, so each instance of Redis can have multiple shards. Our instances of Redis have a lot of keyspaces. Sharding combined with the scale of Twitter create dense backends with lots of keys and databases.
Testing Improvements to Expiration
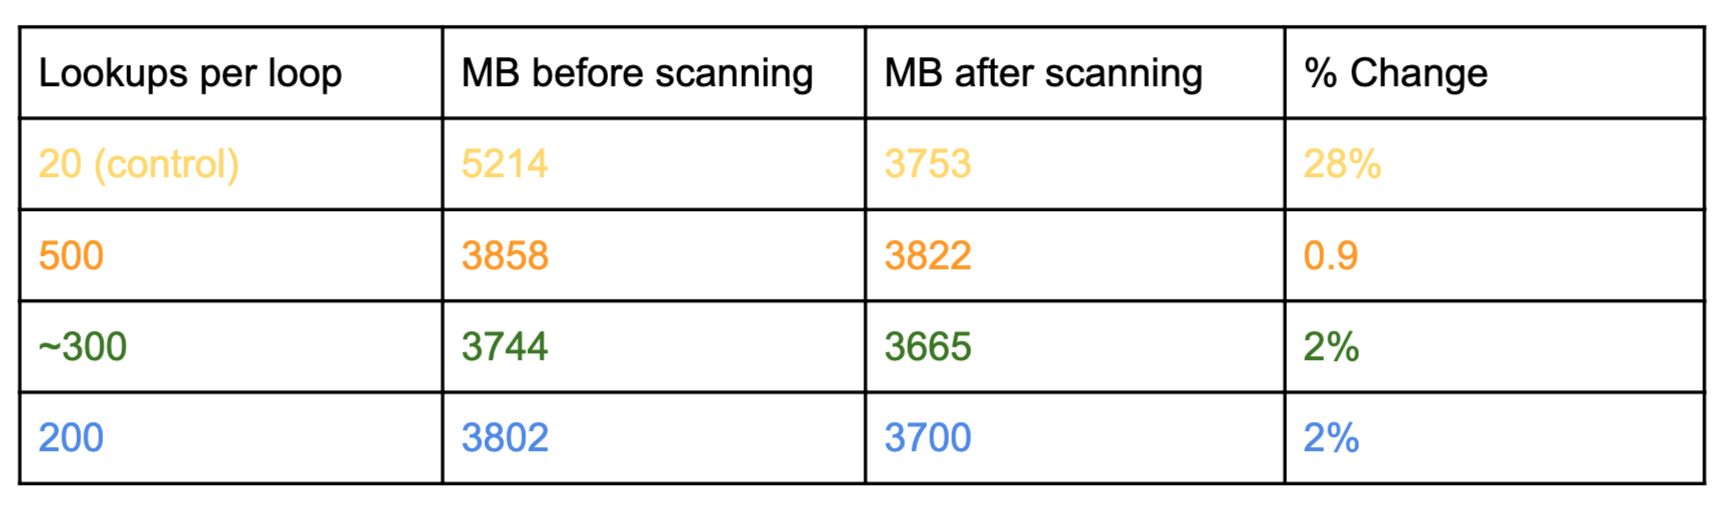
The number sampled on each loop is configured by a variable ACTIVE_EXPIRE_CYCLE_LOOKUPS_PER_LOOP. I decided to test three values and ran them in one of the problematic clusters, then ran a scan, and measured what the difference in memory use was before and after. A large change indicates a sizeable amount of expired data waiting to be collected. This test had positive results initially for memory use.
The test had a control and three test instances that sampled more keys. The numbers 500 and 200 were arbitrary. The value 300 was based off the output from a statistical sample-size calculator where total keys was the population size. In the chart above even just looking at the starting numbers of the test instances it is clear they performed better. The percentage difference from running a scan shows that there was around 25% overhead of expired keys.
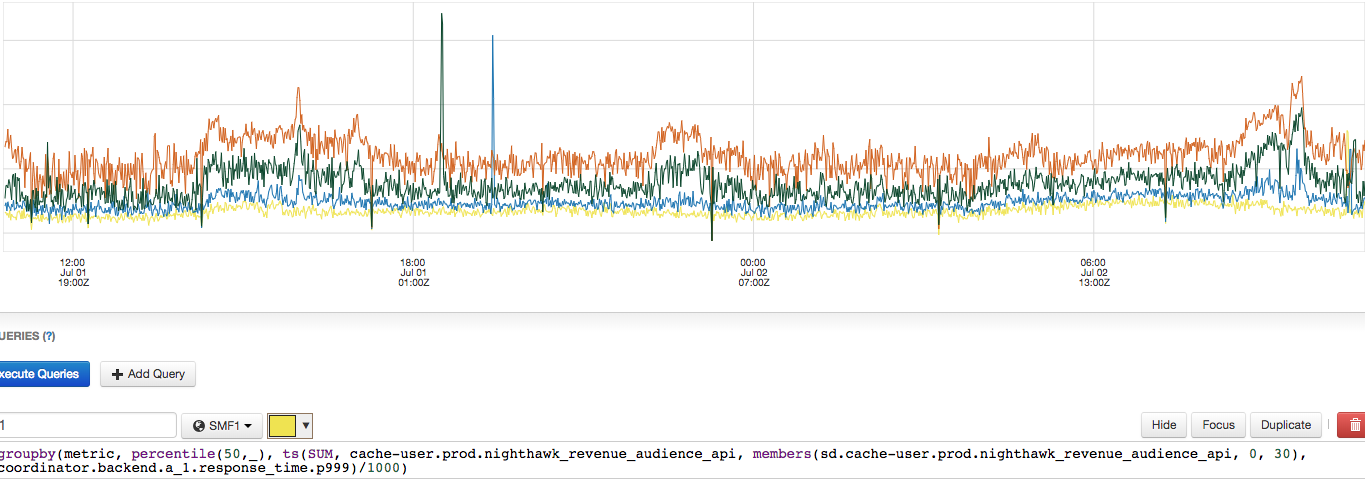
Although sampling more keys helped find more expired keys, the negative latency effects were more than we could tolerate.
The graph above shows 99.9th percentile of latency in milliseconds. This shows that latency was correlated with the increase in keys sampled. Orange use the value 500, green used 300, blue used 200 and the control is yellow. The lines match the colors in the table above.
After seeing that latency was affected by sample size, I had an idea to see if the sample size could be adjusted automatically based off of how many keys there were to expire. When there would be more keys to expire latency would take a hit but when there was no more work to do we would scan less keys and perform faster.
This idea mostly worked, we were able to see memory use was lower, latency wasn’t affected, and a metric tracking sample size showed it was increasing and decreasing over time. However, we didn’t go with this solution. It introduced some latency spikes that didn’t occur in our control instances. The code was also kind of convoluted, hard to explain, and not intuitive. We also would have had to adjust it for each cluster which wasn’t ideal because we would like to avoid adding operational complexity.
Investigating the regression between versions
We also wanted to investigate what changed in between Redis versions. The new version introduced a variable called CRON_DBS_PER_CALL. This set a max number of databases that would be checked on each run of this cron. To test the impact of this we simply commented out the lines
//if (dbs_per_call > server.dbnum || timelimit_exit)
        dbs_per_call = server.dbnum;
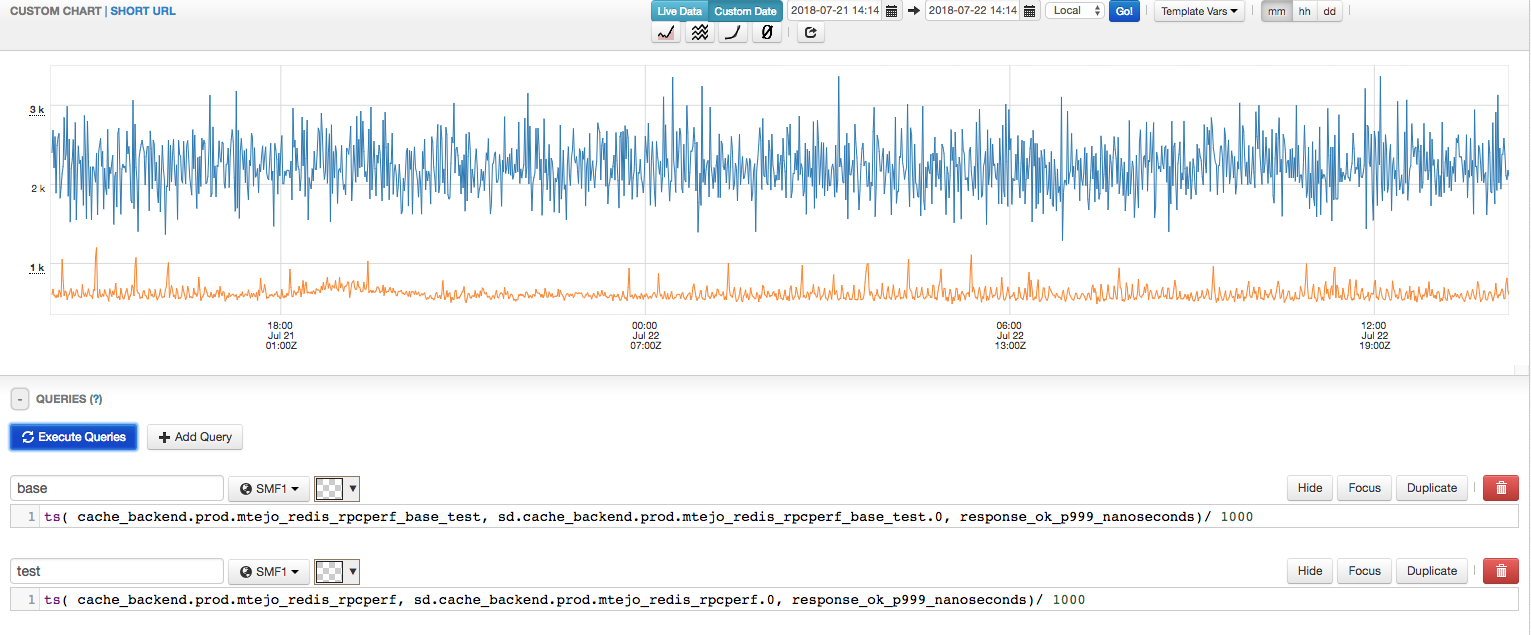
This would compare what the effect was between having a limit and checking all of the databases on each run. The results in our benchmark were excitingly positive. Our test instance only had one database though, logically this line of code made no difference between the modified and unmodified versions. The variable will always be set.
We started to look into why this one line commented out made such a drastic difference. Since this was an if statement the first thing we suspected was branch prediction. We took advantage of gcc’s __builtin_expect to change how the code was compiled. It didn’t make any difference in performance.
Next, we looked at the assembly generated to see what exactly was going on.
The if statement compiled to 3 important instructions, mov, cmp and jg. Mov will load some memory into a register, cmp will compare two registers and set another based off the result and jg will do a conditional jump based off the value of another register. The code jumped to will be the code in the if block or else. I took out the if statement and put the compiled assembly into Redis. Then I tested the effects of each instruction by commenting out different lines. I tested the mov instruction to see if there was some kind of performance issue loading memory or a cpu cache issue but there was no difference. I tested the cmp instruction and there was no difference. When I ran the test with the jg instruction included, the latency went up back to the unmodified levels. After finding this I tested whether it was just jumps or this specific jg instruction. I added non conditional jump instructions, jmp, to jump and then jump back to the code running and there was no performance hit.
We spent some time looking at different perf metrics and tried some of the custom metrics listed in the cpu’s manual. Nothing was conclusive about why the one instruction caused such a performance issue. We have some theories related to instruction cache buffers and cpu behavior when a jump is executed but ran out of time and decided to come back to this in future possibly.
Resolution
We needed to pick a solution to this problem now that we had a better understanding of the causes of the problem. Our decision was to go with the simple modification of being able to configure a steady sample size in the startup options. We were able to find a value that was a good trade off between latency and memory use. Even though removing the if statement caused such a drastic improvement we were uncomfortable making the change without being able to explain why it was better.
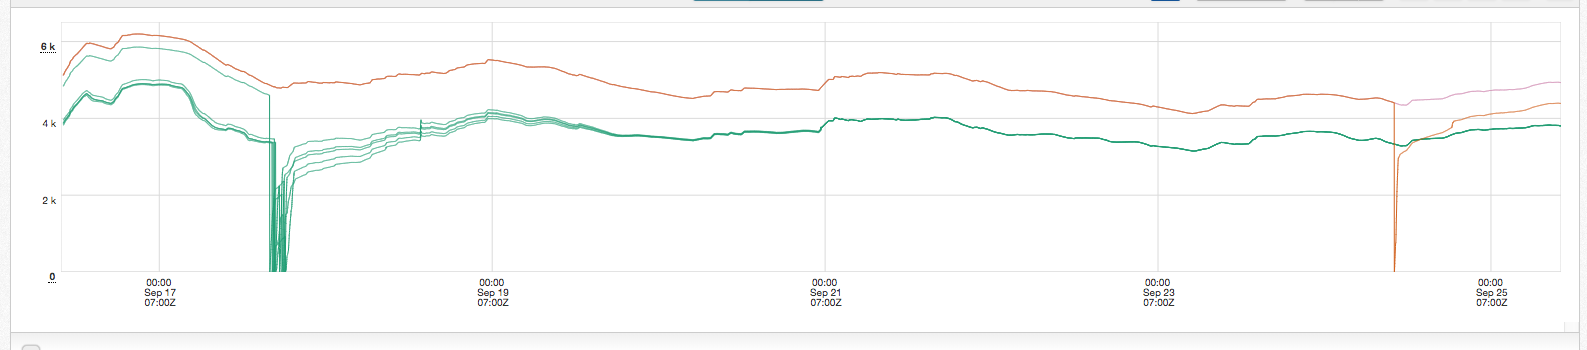
This graph is memory use for the first cluster deployed to. The top line, in pink, hidden behind the orange is the median memory use of the cluster. The top line in orange is a control instance. The middle part of the chart are the canaries of the new change. The third part shows a control instance being restarted to compare with the canary. Memory use quickly increased on the control after restarting.
The patch that contains the new options can been seen here.
This was a pretty big investigation in the end that included a few engineers and multiple teams but a 25% reduction is cluster size is a pretty nice result and we learned a lot! We would like to take another look at this code and see what optimizations we can make with the help of some of our other team focused on performance and tuning too. It seems like there is potentially still a lot to gain.
Some other engineers that made a big contribution to this investigation are Mike Barry, Rashmi Ramesh and Bart Robinson.
Did someone say … cookies?
X and its partners use cookies to provide you with a better, safer and
faster service and to support our business. Some cookies are necessary to use
our services, improve our services, and make sure they work properly.
Show more about your choices.