Infrastructure
How we fortified Twitter's real time ad spend architecture
By
Monday, 2 November 2020
Twitter is a popular place for advertisers to engage with their audiences. When advertisers launch a new campaign, they specify an ad budget which limits how much they will spend. Twitter’s Ad Server checks the campaign’s budget, to determine if an ad can still be served. Without this check in place, we may end up serving ads after a campaign has reached its budget limit, which means we cannot charge for them. We refer to this type of failure as overspend. Overspend can result in lost revenue for Twitter (due to opportunity cost - ex. we could have shown other ads in that slot). It’s important that we build reliable systems to prevent overspend.
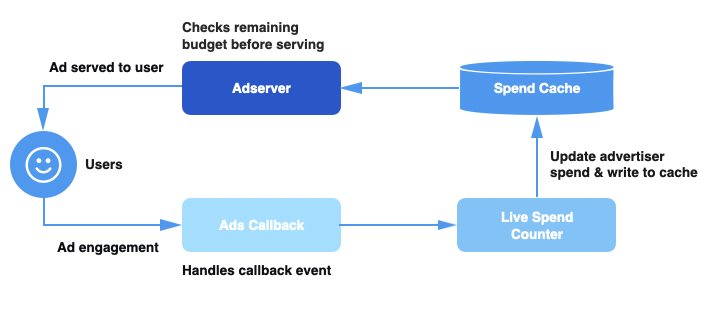
Before diving into how overspend occurs, let’s first understand how an ad is served by our ad system. Here is a high level diagram depicting our ad serving pipeline:
When a user engages with an ad on Twitter, we send an engagement event to our Ads Callback pipeline. Once the Live Spend Counter receives this event, it computes the aggregate spend from the engagements, and updates the campaign spend in the Spend Cache. On each incoming ad request, the Ad Server pipeline queries the Spend Cache to get the current spend of the campaign and determines if the campaign should be served based on the remaining budget.
Given the scale of ad engagements we process (millions of engagement events per second across all data centers), high system latencies or hardware failures could occur at any time in our pipeline. If the Spend Cache is not updated with an accurate and up-to-date campaign spend, the Ad Server would have stale information about how much the campaign has spent and could continue to serve ads for campaigns that have already maxed out their budgets. We would never charge beyond the ad budget limits, so instead, this leads to revenue loss for Twitter as we could have potentially served ads from campaigns that have not yet exhausted their budgets.
For example, imagine an ad campaign with a daily budget of $100 and the price-per-click is $0.01. In the ideal scenario with no overspend, this yields a total of 10,000 clicks per day for the campaign.
Suppose the Ads Callback pipeline or the Live Spend Counter experiences a failure causing the Spend Cache not to get updated, missing $10 worth of ad engagements. The Spend Cache would report only $90 spent when in reality the campaign has already spent $100. The campaign would get an additional 1,000 free clicks.
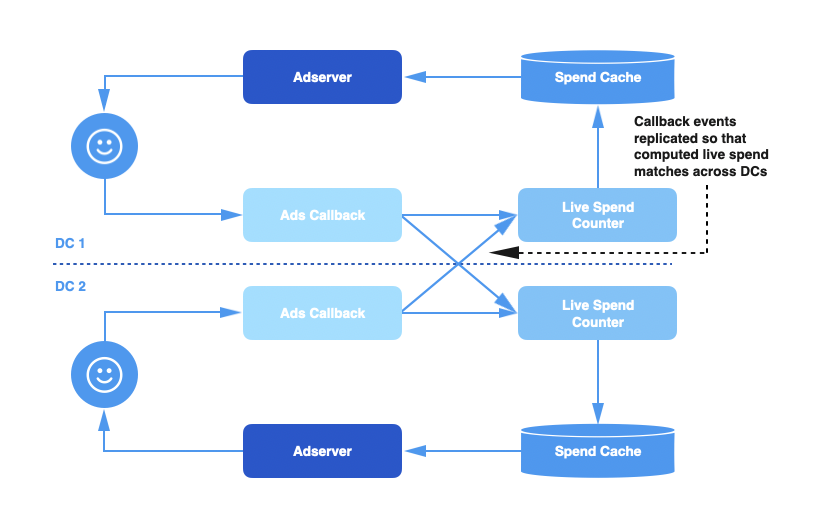
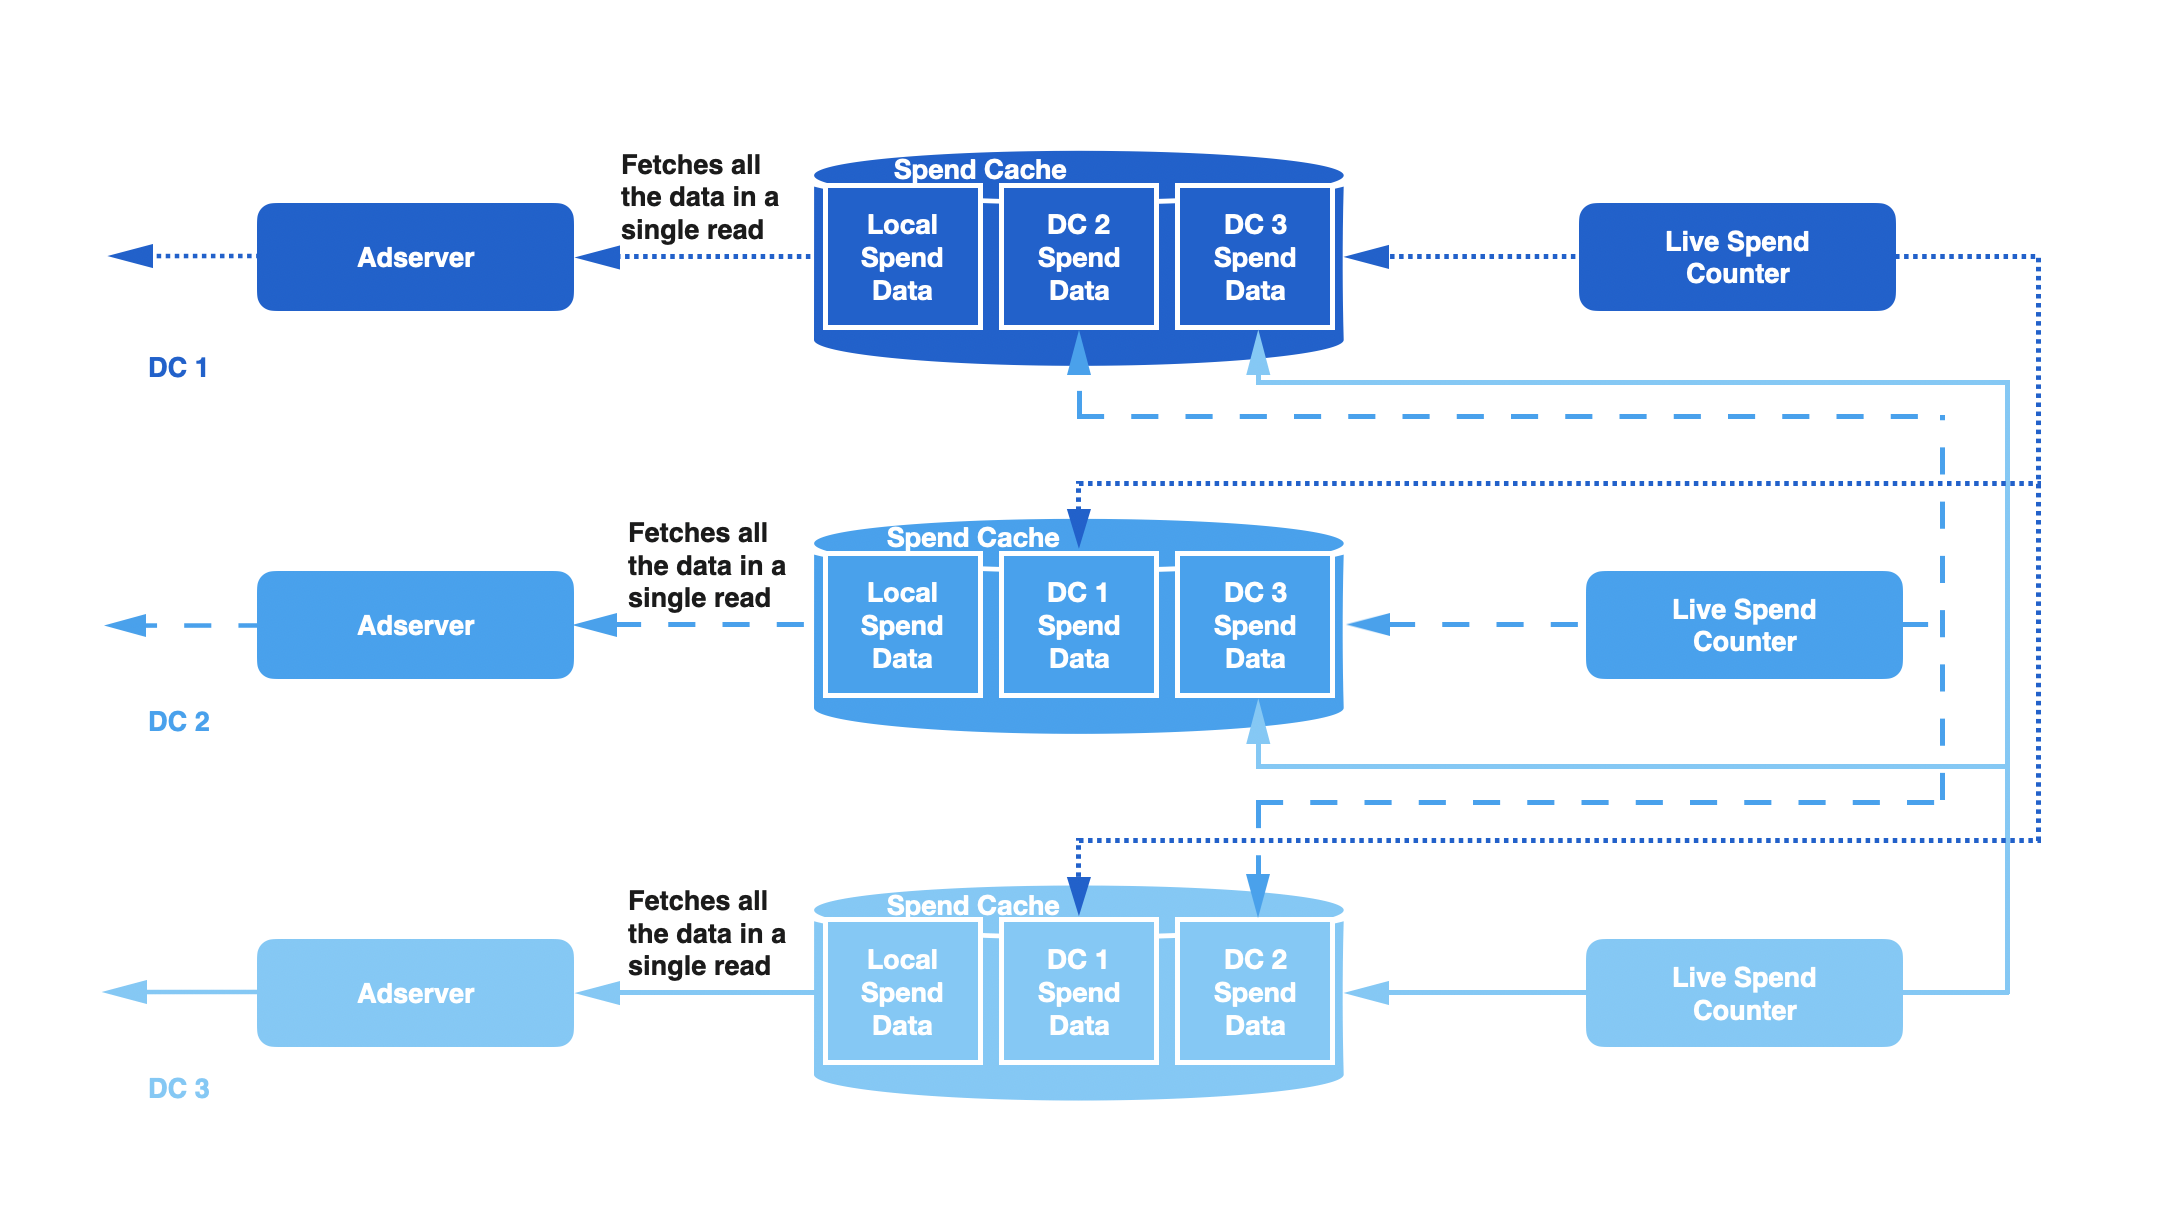
Twitter has multiple data centers, and each one has a replica of the entire ad serving pipeline, including its own Ads Callback pipeline, Live Spend Counter, and Spend Cache. When the user engages with an ad, the callback event is routed to one of the data centers where it is processed by the callback pipeline.
However, this creates an issue where the total spend computed in each data center only accounts for engagement events received by that data center but not the others. Since advertiser budgets are global across data centers, this means that the spend information in each data center is incomplete and may underestimate the actual spend of any given advertiser.
To solve this problem, we added cross-data center replication to our callback event queues, so that each data center processes all engagement events. This ensures that the spend information in each data center is complete and accurate.
Although replicating engagement events gave us better consistency and accurate spend information, the system was not very fault tolerant. For example, every few weeks, cross data center replication failures would cause the Spend Cache in the affected data center to go stale due to missing or lagging events. Typically, the Ads Callback pipeline would have system issues such as a GarbageCollection (GC) pause or unreliable network connection in one data center resulting in a lag of event processing. Since this is local to only a single data center, the Live Spend Counter in that data center would receive the events with a delay directly proportional to the lag, and as a result the Spend Cache updates would also be delayed leading to overspend.
In the past, we mitigated these types of failures by disabling Live Spend Counter in the failing data center, and configuring the healthy Live Spend Counter in the other data center to start writing to both its local Spend Cache and to the Spend Cache in the failing data center, until the lagging Ads Callback pipeline and Live Spend Counter were caught up.
This workaround was effective in temporarily avoiding overspend, but had several major drawbacks:
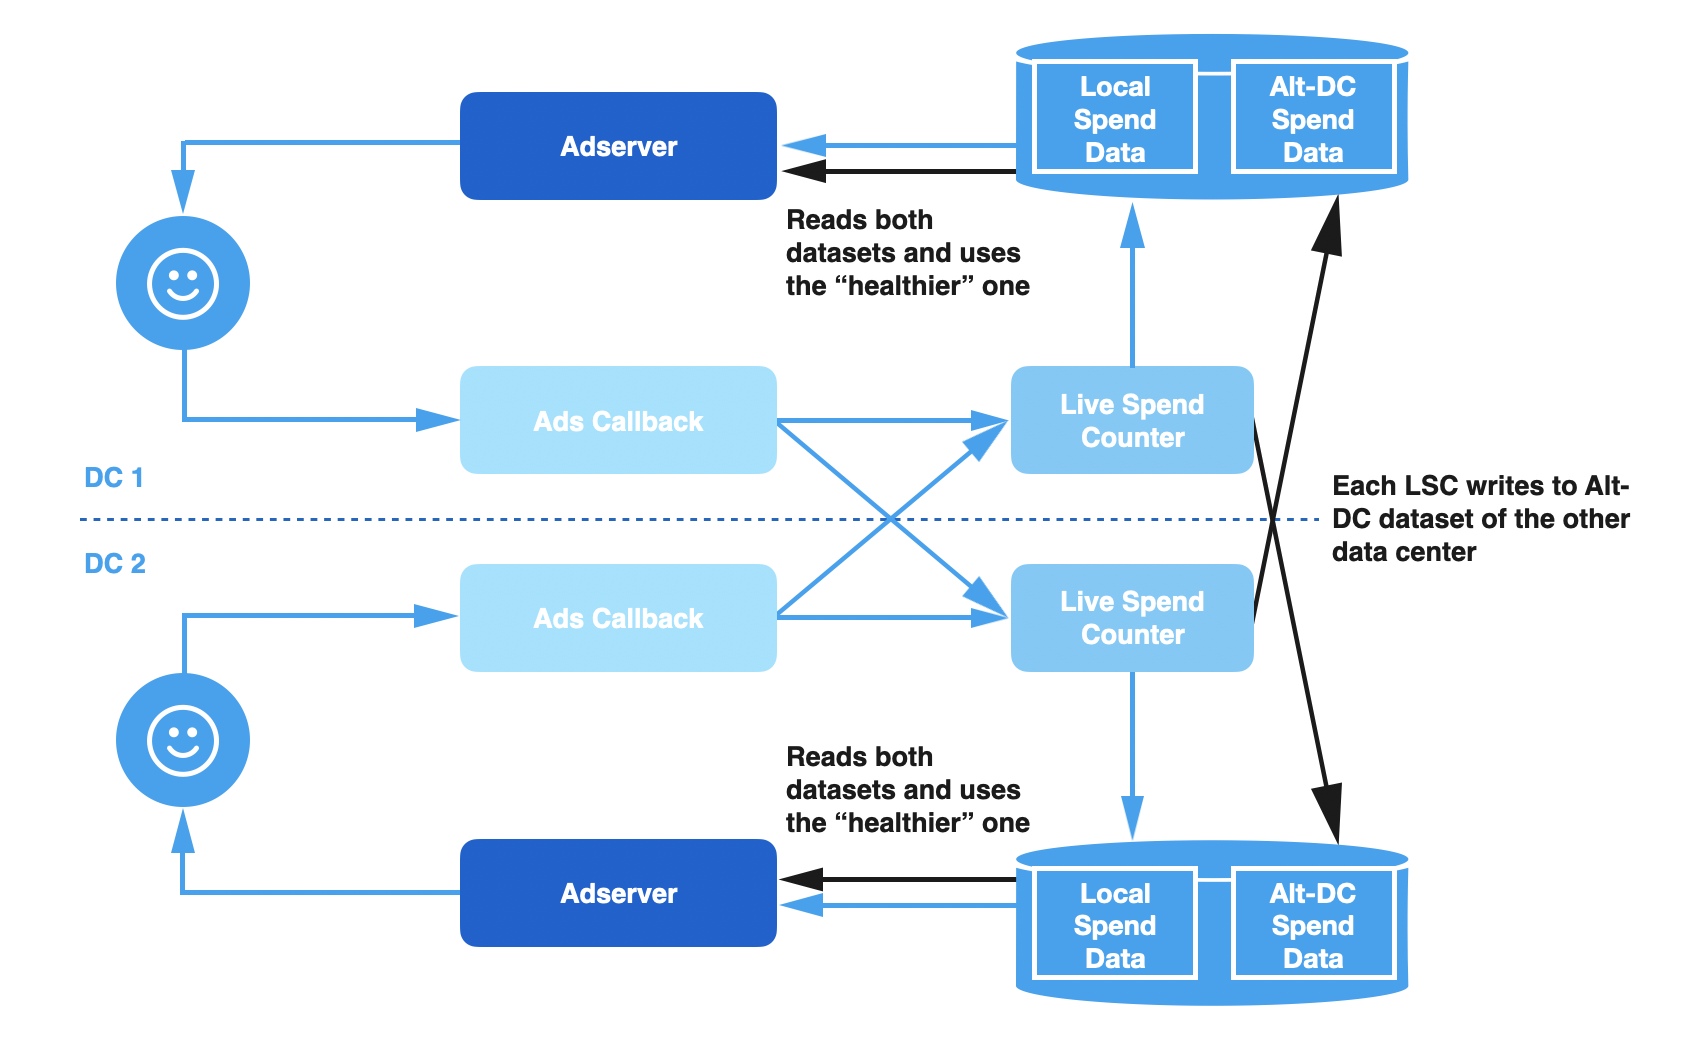
Due to the many problems with this architecture, we re-designed our pipeline so that it could be more resilient to failure and require less operator intervention. The solution had two main components:
During normal operations, this system works identically to the previous design. However, if the local Spend Cache falls behind, the Ad Server is able to detect this and switch automatically to using the data set containing the writes from the remote data center. When the issue is resolved locally, the Ad Server will automatically switch back to using the local dataset since it is as healthy as the other one.
How Do We Pick Which Dataset is Healthier?
Our criteria for determining health is informed by the common failure scenarios:
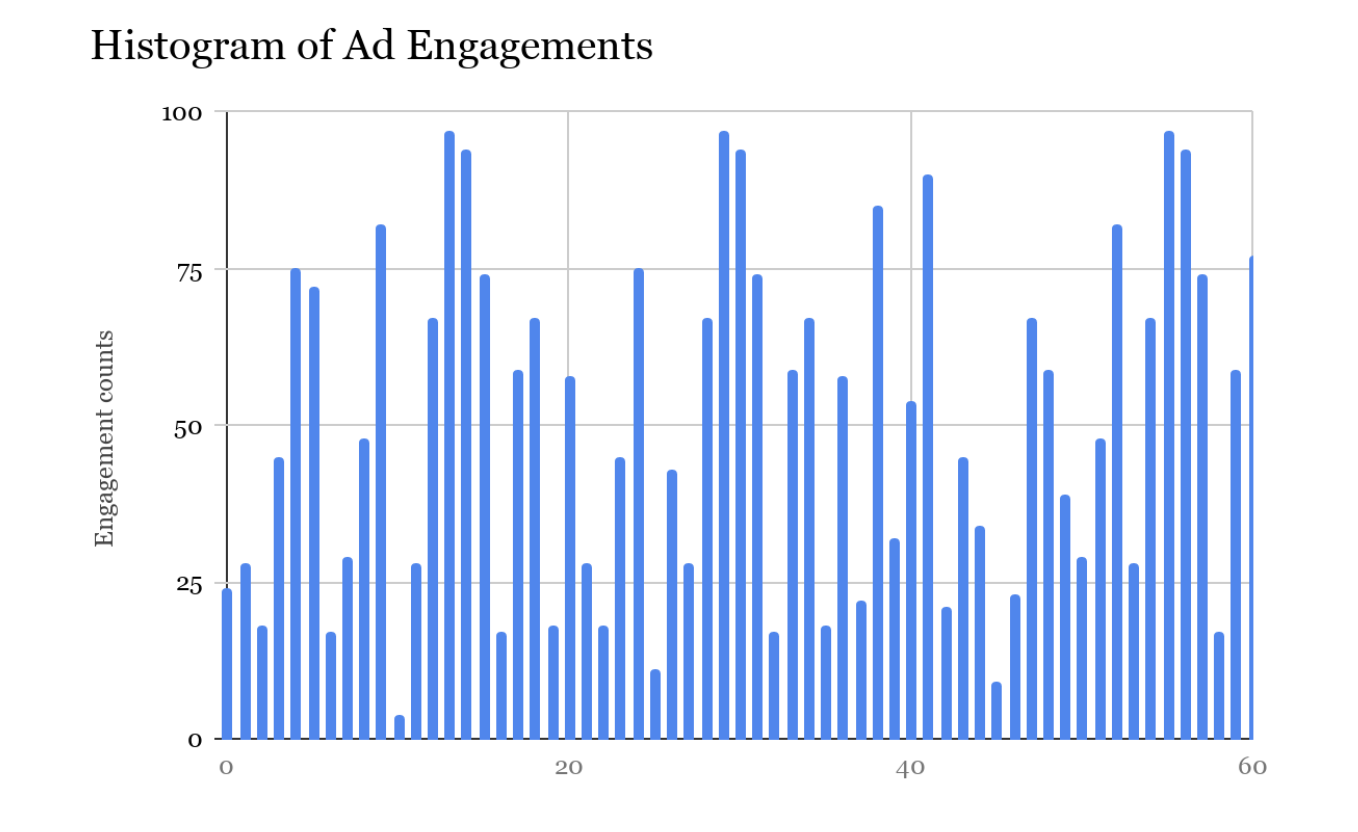
In order to build a health check that considers both factors, we introduced the concept of a spend histogram.
Spend Histogram
Imagine we have a rolling window of the count of ad engagement events being processed by the Live Spend Counter (LSC) service in each data center at any given moment in time. The rolling window contains counters that track how many events were processed per millisecond, for the most recent 60 seconds. At the end of each window, we drop the count from the head of the counters and start recording the count at the tail for the next 1ms. This gives us a histogram of the “count of events” processed by LSC within 60secs. The histogram would look something like the diagram below:
To choose the best dataset of spend information (on the ads serving side), we use this histogram AND the timestamp of the most recent ad engagement event. The LSC writes this metadata into the Spend Cache alongside the spend data.
The LSC doesn’t serialize/deserialize the entire histogram while writing. Before writing, it sums up the counts across all counters in the window and writes an aggregated value. Using an approximate number of events is sufficient, and it serves as a good signal for the overall health of the LSC in that data center. This works because of the nature of failures - if they’re severe enough, we’d see the impact right away and the counts would drop significantly. If they aren’t very severe, the counts will be nearly the same.
The structure containing the metadata looks something like this:
struct SpendHistogram {
    i64 approximateCount;
    i64 timestampMilliSecs;
}
While serving a request, the Ad Server reads from both the local and remote datasets. It uses the SpendHistogram to decide which spend dataset to use as the source of truth based on the data center selection logic described below.
Data Center Selection
The logic used to select the preferred dataset works as follows:
This can be summarized into the following truth table to make the decision:
x = LocalTimeStamp - RemoteTimeStamp
y = LocalApproxCount - RemoteApproxCount
ts = ThresholdTimeStamp and
tc = ThresholdApproxCountPercent
We use ts and tc to determine the threshold of tolerance before making the switch to using the dataset from the remote data center. As we can see, we bias more towards the local dataset if the difference is within the threshold. We experimented to find threshold values that allow us to detect failures early enough without flip-flopping between the data centers. This selection process happens on every request in the Ad Server, so we cache the values locally, with a refresh every few seconds to prevent frequent network fetches from impacting overall performance.
Captured below is a visual representation of how the switch from using the dataset in one data center to another happens. When a fault occurred in LSC in DC1, it caused the data from DC2 to be selected automatically by the Ad Server (in DC1).
The approach that we’ve covered so far talks about the design with just two data centers. We can extend the design to ‘n’ data centers by introducing the concept of Replication Factor for cross-data center writes. Replication Factor controls the number of remote data centers that each LSC service writes to. On the read path, we use the same logic of selecting the data center with the most healthy dataset, with an optimization of fetching all the necessary data in a single read (batched read) instead of multiple reads.
For example, suppose the ReplicationFactor is set to two (2). LSC in DC1 would write to Spend Caches in DC1, DC2 and DC3; LSC in DC2 would write to caches in DC2, DC3 and DC4; LSC in DC3 would write to caches in DC3, DC4 and DC1 and so on. The diagram below shows how this would work with three (3) data centers. In each of these data centers, Ad Server would read three (3) copies of the Spend Histogram and select the preferred dataset from all of them. Based on our network and storage constraints, we chose a replication factor of two (2) for our use case.
After rolling out these changes, we noticed an immediate impact in terms of the operational burden on the teams. We went from having multiple overspend incidents due to system issues in the Spend pipeline each quarter, to having zero such incidents in the past year. This freed up a lot of engineering time in dealing with operational issues and prevented returning credits to advertisers due to infrastructure issues.
We solved a critical operational problem that impacted the correctness of our serving pipeline by identifying the key indicators of system health and designing the simplest possible engineering solution to take automated action based on those indicators. This not only resulted in a fault tolerant and resilient system but also freed up engineering resources that can be channeled in a better direction.
If you're interested in solving such challenges, follow @TwitterCareers and come join the flock.
This project took commitment, cross-functional alignment and work from many teams. We would like to thank project leads who contributed to this blog: Akshay Thejaswi, Andy Tao, James Gao, and Udit Chitalia.
And others who contributed to this project: Alexei Dounaevski, Ankita Dey, Bhavdeep Sethi, Brian Brophy, Dharini Chandrasekaran, Dwarak Bakshi, Eddie Xie, Eitan Adler, Eric Chen, Irina Sch, Kavita Kanetkar, Nikita Kouevda, Paul Burstein, Praneeth Yenugutala, Rachna Chettri, Siva Gurusamy, Somsak Assawakulpaibool, Tanooj Parekh.
We would also like to thank members of the Revenue Serving, Revenue Processing and Revenue SRE teams for their help through the project.
Did someone say … cookies?
X and its partners use cookies to provide you with a better, safer and
faster service and to support our business. Some cookies are necessary to use
our services, improve our services, and make sure they work properly.
Show more about your choices.