Infrastructure
Introducing VMAF percentiles for video quality measurements
By
Monday, 9 November 2020
At Twitter, we want to deliver a delightful video experience to our customers through videos that load instantly, don’t stop unexpectedly, and always look crisp. In this blog post, we introduce a new visual quality assessment method that relies on computing Video Multimethod Assessment Fusion (VMAF) percentiles. Using VMAF percentiles, we can infer how an encoding technique performs on some of the most complex frames and allows us to focus on improving their quality first. Additionally, VMAF percentiles are more intelligible to non-video engineers and offer an alternate understanding of the impact of encoding algorithms on video quality.
Every day, millions of people come to Twitter to see what’s happening and get a fresh perspective on events shaping our times. A large number of advertisers rely on us to get their message across, and this helps them grow their business. Video is a core piece in this experience. We want to enable public conversations by making watching video seamless and enjoyable. We do this by striking the right balance between quality, responsiveness, and interoperability between a broad range of devices and platforms. There are other important considerations, for instance, serving video reliably in any part of the world at any time and ensuring that we meet our customers’ privacy expectations.
In recent months, video consumption on Twitter has seen an unprecedented growth. This, along with the fact that mobile devices have bigger and better screens every year, makes it clear that investing in video compression technologies should be vital in our long term strategy. Next generation codecs like HEVC, AV1 and VVC have demonstrated impressive coding efficiency improvements over H.264. We think it is important for a codec to strike a balance between coding efficiency and computational complexity, enabling hardware decoding capability. This saves battery life and allows the CPU to do other important tasks. With all the available encoding options and tradeoffs to consider, it becomes even more important to invest in a reliable video quality evaluation method that helps us make decisions quickly and has a low barrier to understanding.
To this end, Peak Signal to Noise Ratio (PSNR) remains the de facto industry standard for video codec standardization. However, researchers in the video coding industry are well aware of its limitations. For instance, it does not consider the temporal nature of compression artifacts or the fact that in the presence of camera noise, PSNR improvements especially do not correlate with subjective quality.
VMAF is an objective metric developed as a joint collaboration between Netflix, the University of Southern California, and the University of Texas at Austin. VMAF has consistently shown to be closer to human visual perception than PSNR or any other objective metric. It is a combination of several spatial and temporal metrics that are fused using machine learning models. A VMAF score is simpler to understand because it operates in a linear range of 0 to 100, whereas PSNR is logarithmic. It takes into account scaling and compression artifacts, and additionally, has a model that is trained for mobile video consumption.
Being a mobile-first platform, Twitter cares deeply about serving high quality video to small screens at scale. In our previous blog post, we introduced a new subjective visual quality assessment method called Adaptive Paired Comparison. Adaptive Paired Comparison was designed for mobile video consumption and measures visual quality more reliably than industry standards Mean Opinion Score and Double-Stimulus MOS. As a next step, this blog introduces an objective video quality assessment method that computes percentiles of VMAF scores across all frames in a sequence. The method is well-suited for mobile video consumption and we used it to optimize our live encoding ladder. We see it as a valuable alternative to the Bjontegaard Delta (BD)-rate method.
Clients use adaptive bitrate streaming algorithms to select the variant that maximizes video quality while avoiding playback rebuffers. However, we would also like to maximize perceived quality at whatever bitrate the adaptive bitrate algorithm chooses. The encoder’s rate control aims to maintain consistent quality for all frames, saving bits when it can and restricting bitrate when needed. If we don’t restrict bitrate, almost all frames would get a near-perfect VMAF score. Video quality loss happens notably when we limit bitrate.
As discussed on VMAF GitHub, aggregating VMAF scores of frames by averaging over the entire sequence may hide the impact of difficult-to-encode frames (if these frames occur infrequently). An optimal way to pool frames is an open problem. For example, VMAF tools can already aggregate harmonic mean and output one percentile score. In the context of this blog, after calculating VMAF scores of all frames of a sequence, we compute the 1st, 5th, 10th, 25th, and 50th percentiles. By definition, the 5th percentile gives us a VMAF score of the worst 5% frames while the 50th percentile is the median. The intuition here is that instead of weighing all frames equally and getting one score, we rank frames according to their complexity and look at how a particular encoder setting performs across these different ranks. We want to prioritize improving quality on frames in the order of their VMAF scores, from lowest to highest. Frames with a high VMAF score already look great and improving quality on them won’t matter as much.
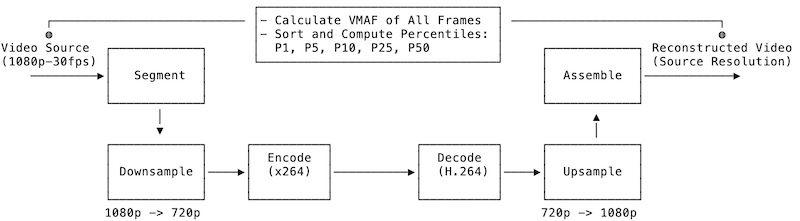
We selected four 1080p/60fps video clips of one minute duration from xiph.org. The testing pipeline is shown below:
To deliver video files in adaptive bitrate format, ingested input video is broken down into multiple small segments. This process is called segmentation. Segmentation enables players to gracefully change bitrate and resolution as network conditions change. The input is an RTMP ingest that is segmented into several three second transport-stream segments. The downsampling process converts video from the input to the target variant resolution, for example, from 1080p to 720p. Finally, we feed the downscaled video to the x264 encoder. The downsampling and encoding are performed using the following FFmpeg command:
ffmpeg -i input.ts -vf scale=1280:720 -c:v libx264 -tune psnr -x264-params vbv-maxrate=2500:vbv-bufsize=2500 output.ts
The above command down-samples the source to 720p resolution with the default bicubic algorithm. The command then encodes the source using x264 with Constant Rate Factor (CRF) rate control via the default CRF value of 23. CRF is a good practical setting for live streams as it can work on a window of frames with limited lookahead, does not need intermediate files, and saves bits when the content is easy (for example, static frames).
If the content is difficult to encode, we cannot let the encoder spend an infinite number of bits. Therefore, we need to cap the data rate by setting the vbv-maxrate and vbv-bufsize parameters. In this regard, visual quality loss happens whenever we hit the data rate ceiling. This is usually because the content was difficult and the encoder was challenged to keep bitrate within budget.
The -tune psnr parameter disables psycho-visual optimizations in x264. This is because while these optimizations improve perceived quality, they increase the differences between source and compressed video and hence lower PSNR (and VMAF) scores.
To measure VMAF scores against original input, encoded video has to be decoded, upsampled and assembled together. In the end, the VMAF of the assembled video is computed against the ingested input stream for every video frame. As mentioned earlier, we are interested in a VMAF training model that is tailored for mobile phone viewing, that is to say when the viewing distances are more than 3x video height.
When we run x264 against the four sequences mentioned above, compute the average percentiles and plot them, we get a VMAF Centile Plot (VMAF-CP) that looks like this:
At first glance, VMAF-CP looks similar to the rate-distortion plot that is widely used in standards development. This is because as VMAF percentiles increase along the x-axis, scores also increase monotonically. There are notable differences, however. Typically, rate-distortion plots are obtained from running four or more encodes at constant quantization parameter settings, measuring PSNR or VMAF of all frames and using the average as the quality metric. In this setting, rate control is usually turned off. This makes sense for standards development where coding tools are developed, however, our preference is to evaluate visual quality using the CRF rate control algorithm that we use in production.
For the data shown above, the average VMAF of all frames is 97.7 (100 is the highest achievable score). Thus, using the average VMAF of the frames of a sequence as the video quality metric misleads us into believing that the overall video quality is very good. However, if we look at the 1st, 5th and 10th percentiles, we can see that there is an opportunity to lift the quality of the worst-performing frames.
As an example, let’s imagine that we want to pick an x264 preset for our transcoding stack. Presets in x264 categorize encoding tools such that one can select encoder speed to achieve certain compression quality. In the above FFmpeg command, we did not specify a preset, so the default preset of medium was used. Next, we encode x264 with preset values of veryfast, faster, fast, medium, slow and slower and plot VMAF percentiles in the figure below:
As expected, the veryfast preset produces the lowest quality, and the quality jump from veryfast to faster is the steepest. As we move from faster to fast, there is still a decent quality jump. The fast and medium presets achieve similar quality since the curves lie very close to each other. The slow and slower presets give further quality improvements. On the other hand, if we only looked at the average VMAF scores (shown below), it is hard to gauge the impact of different presets on quality, as the numbers are almost the same.
|
|
|
|
|
|
|
|
|
|
|
|
|
|
To run encodings that meet practical constraints at scale, we have to be mindful of the CPU spent per encode. Our goal is to achieve the highest visual quality under a given CPU budget and not spend cycles in encoding tools that do not contribute to this improvement in an impactful way. In the following table, we list the CPU time spent in each preset relative to the veryfast preset on a machine with 3.1GHz Quad Core i7 CPU. About 13% more compute is required to encode x264 medium preset and the quality improvement is not justifiable (the last two rows show incremental VMAF increase for 10th and 25th percentiles for each preset, relative to preset on left column). Because of this reason, the fast preset is the preferable setting in this case.
|
|
|
|
|
|
|
|
|
|
|
|
|
|
|
|
|
|
|
|
|
|
|
|
|
|
|
|
|
|
|
|
|
|
|
|
|
|
|
|
Here is an example frame showing visual quality of veryfast (left) vs fast (right) preset for grand_theft_auto sequence:
From this little example, we hope to explain that VMAF-CP plots are a robust methodology for tuning codec parameters to get the desired visual quality for mobile video consumption.
One way to design an encoding ladder is to use Convex Hull Optimization (CHO), whereby we draw rate-distortion curves for each variant resolution and select bitrates that keep us on the envelope of the rate-distortion curves. CHO is a well-studied technique, but it typically relies on the plotting of rate-distortion curves averaged over the frames of a sequence. When CHO is used with CRF rate control, averaging the PSNR or VMAF scores over the frames of a sequence is misleading because the majority of frames are often much higher quality than the lower percentiles. Hypothetically, one could sweep rate-distortion curves in CRF mode, but our experiments show that under practical rate points, VMAF scores averaged over the frames of a sequence don’t allow us to discriminate between quality improvements.
VMAF percentiles can help here. From only five encodings, we can quickly get an idea of how our existing ladder is performing in terms of visual quality. Let’s take the 720p at 2.5Mbps variant example from the earlier section, pick the fast preset, since it looks to be a reasonable tradeoff point, and presume additional variants as follows:
|
|
|
|
|
|
|
|
|
|
|
|
|
|
|
|
|
|
|
|
|
|
|
|
|
|
|
|
The VMAF-CP of this ladder is shown as follows:
In the above plots, we can see a regular jump in quality as we move up the ladder. This is desirable because we want to see a meaningful increase in quality from each variant. We don't want to see variant curves getting close to each other as that would indicate an underperforming variant. Our highest variant achieves a 98+ VMAF score in the 25th percentile. This indicates that if a video player is able to upgrade to this variant, for 75% of the frames, the video has an almost-perfect visual quality. In the interest of brevity, we chose to run encoding of these variants using the fast preset, although with only a small number of additional encodings, one can select the best preset for each variant. Further possibilities could be trying out other CRF values, group of pictures structures, or other x264 settings.
We can also use the above approach to devise bitrates for the higher frame rate variants. For instance, let’s assume that we want to serve a 720p/60fps variant in the above ladder at the visual quality of the 720p/30fps variant. Since the encoder is encoding twice the number of frames, if we serve the 720p/60fps variant under the same bitrate constraints as 720p/30fps, the visual quality will not be as good as the 30fps variant. To determine how much to increase the bitrate to achieve similar quality as the 720p/30fps variant, let’s set up an experiment where we encode the 720p/60fps variant at the following bitrates and measure VMAF percentiles for each data point:
|
|
|
|
|
|
|
|
|
|
|
|
|
|
|
|
|
|
In the following plot, we draw VMAF percentiles of the above four rate points and compare against the 720p/30fps variant that we had already selected before. We can see that to meet the quality of the 30fps variant, the bitrate of the 720p/60fps variant needs to be increased to approximately 3.6Mbps. Otherwise, the 60fps variant may suffer from compression artifacts more than the 30fps variant.
VMAF is a visual quality metric that is closer to human visual perception than PSNR and is continuously improving, thanks to the open source community. It was designed originally with broadcast quality content use cases and works well with existing rate-distortion optimization techniques, such as BD-rate and Convex Hull Optimization. VMAF percentiles allow us to make better and faster speed-vs-compression efficiency decisions, by providing data on how an encoding technique performs on some of the worst frames, not just averaged over all frames. Moreover, the calculation is simpler to comprehend for non-video engineers. The calculation only involves calculating the VMAF scores of all frames, computing percentiles, and plotting or tabulating them from lowest to highest.
More work is needed to determine the correlation of VMAF percentiles with human visual perception. In this regard, one could measure the relationship between VMAF percentiles and Mean Opinion Scores and compare with existing techniques, for instance, rate distortion optimization using averages. The focus of this blog post was on tuning the x264 encoder, however, we could also compare the next generation codecs. This may shed new perspectives into their performance for practical applications.
Did someone say … cookies?
X and its partners use cookies to provide you with a better, safer and
faster service and to support our business. Some cookies are necessary to use
our services, improve our services, and make sure they work properly.
Show more about your choices.