Infrastructure
Storing and retrieving millions of ad impressions per second
An important component of any ads ecosystem is the ability to store and retrieve ad impression metadata accurately and consistently. This infrastructure powers our analytics pipelines, billing systems, and prediction models. Given the centrality of this system, it’s important that it evolves with the growing needs of the business and the Revenue organization. The previous iteration of this system at Twitter was designed almost ten years ago, when our team was much smaller and served only a single type of ad. Today, Twitter’s Revenue organization consists of 10 times more engineers and ~$3.7B of revenue, supporting multiple ad formats — Brand, Video, and Cards. We set out to design a system to meet the growing demands of our platform.
How we stored ad impressions in the previous decade
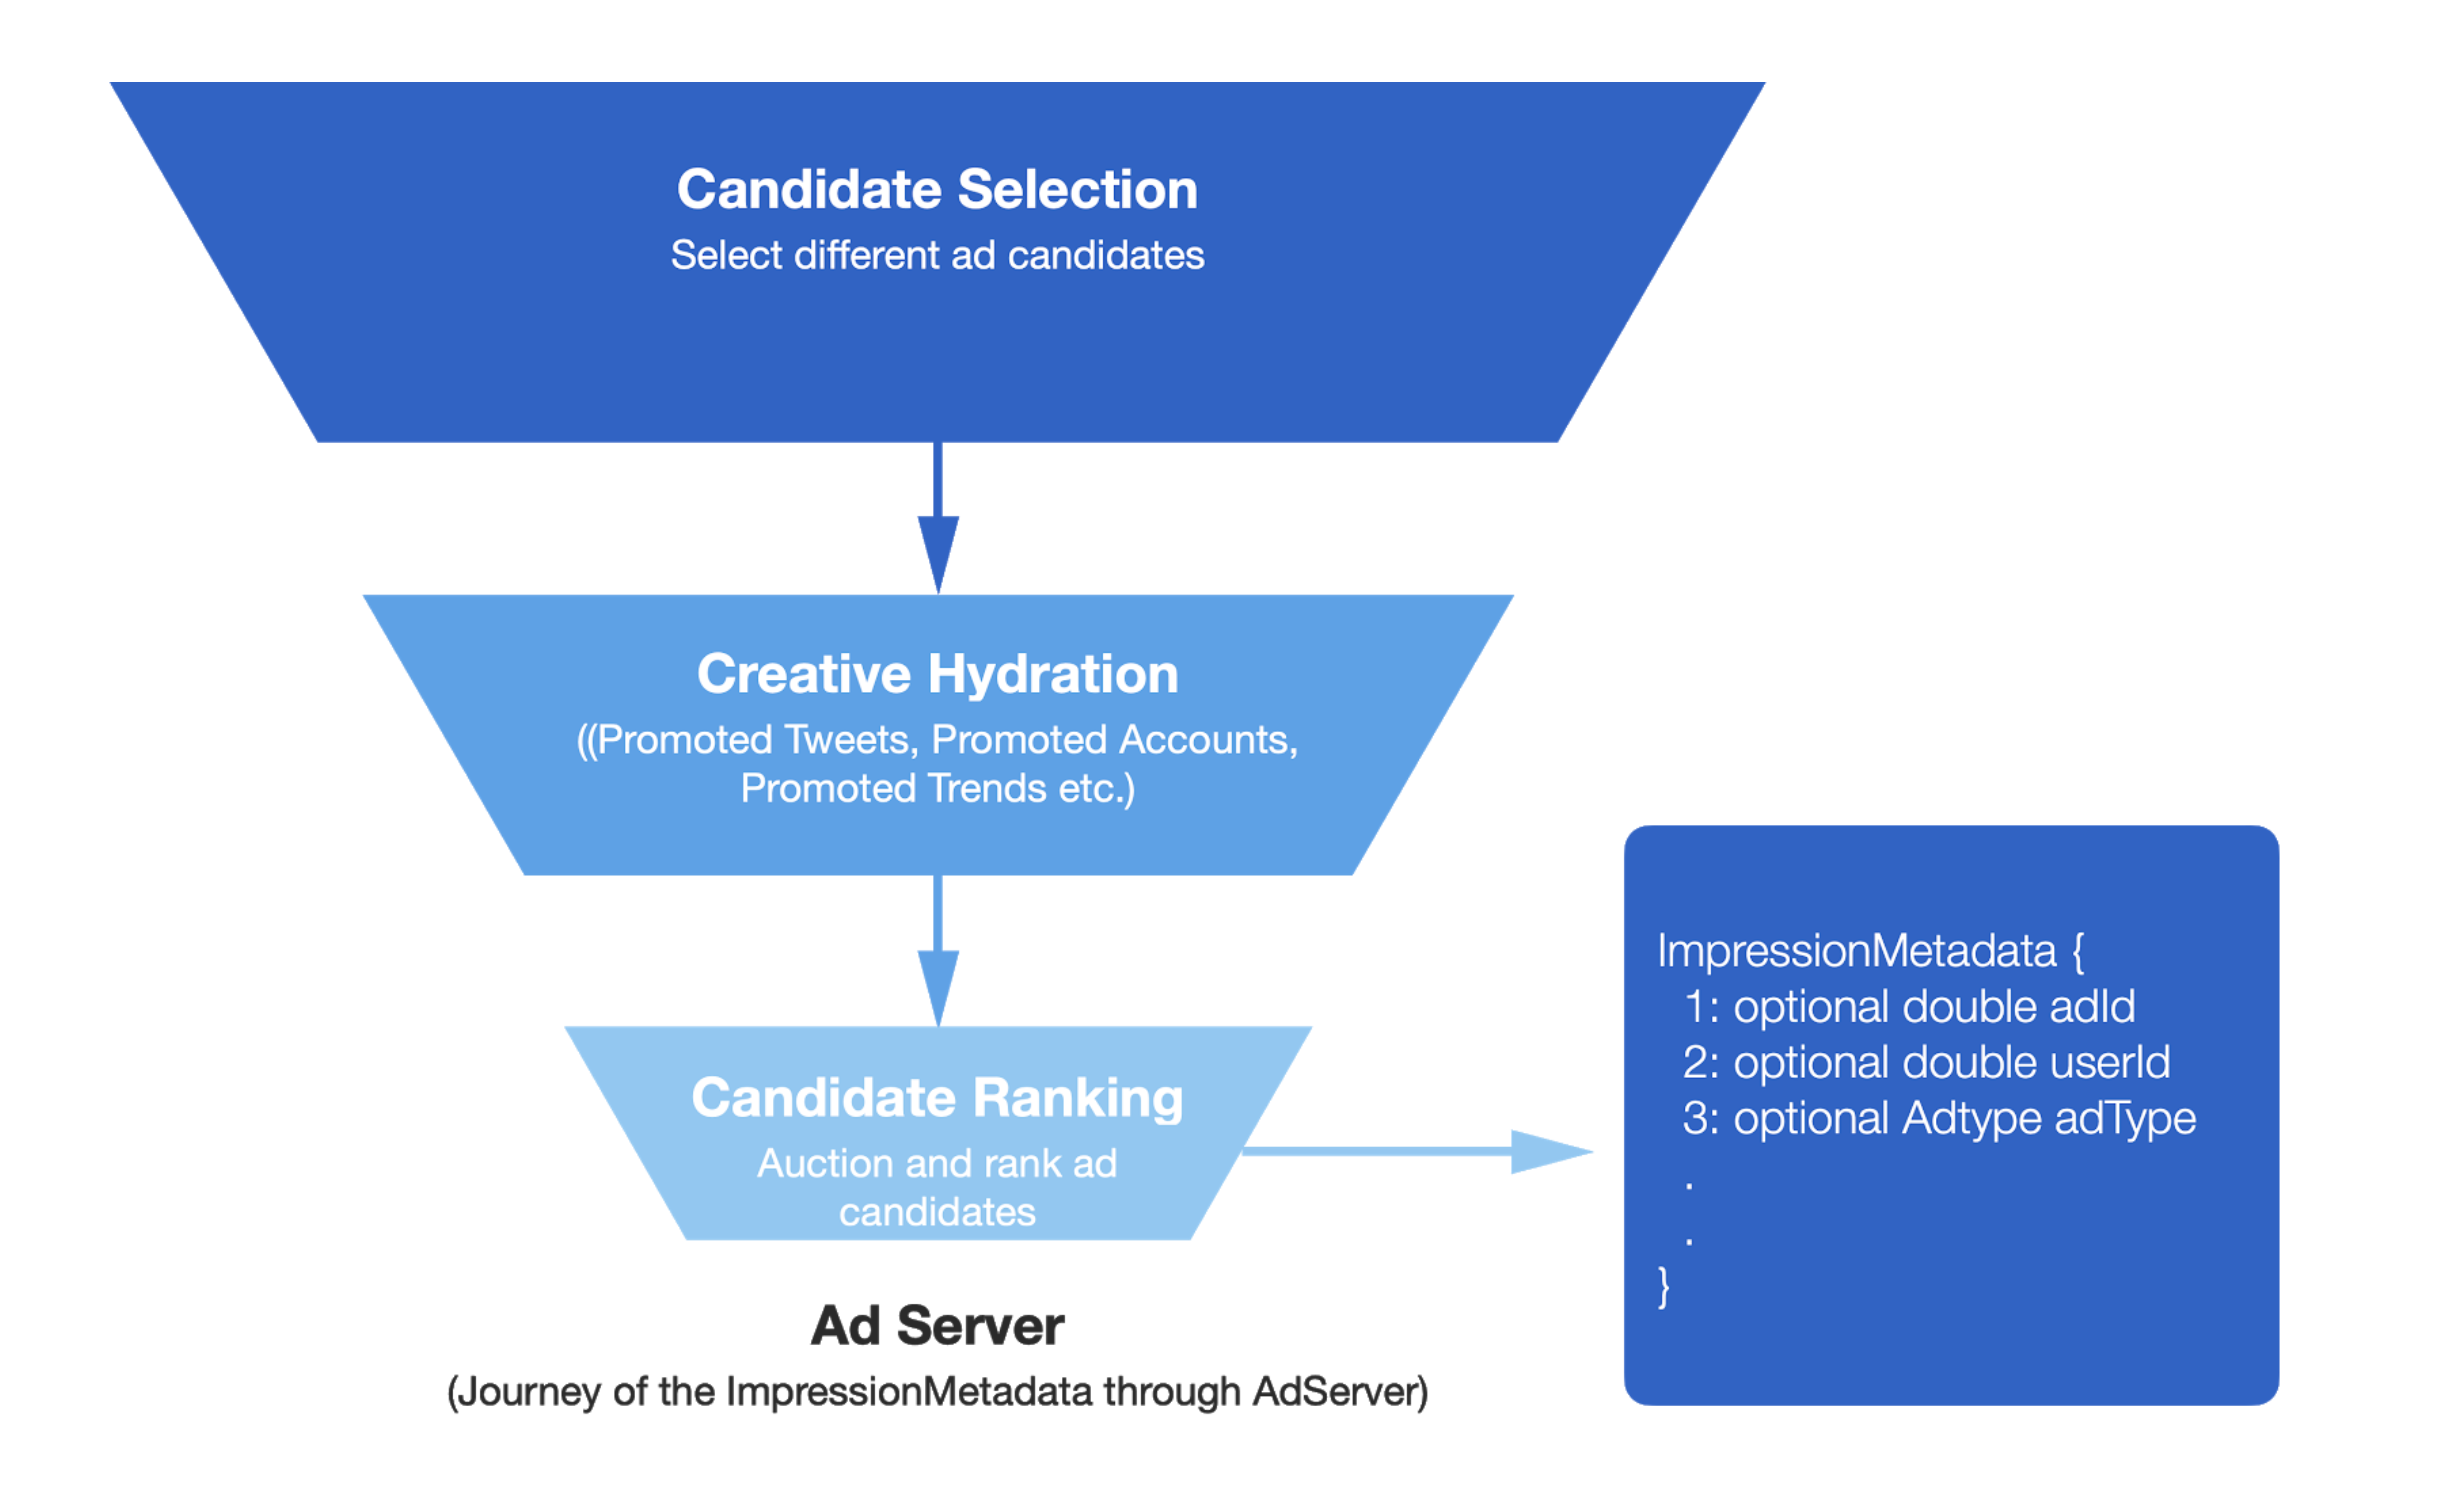
Before we dive into what the system looks like today and how we came to design it the way we did, let’s briefly look at the past. The AdServer can be thought of as a funnel consisting of multiple stages that filter the number of ad candidates and run them through distinct stages. Once it selects a set of ad candidates, the results are sent back to users’ timelines, where ads are displayed.
There are three distinct stages in the AdServer: Candidate Selection, Ranking, and Creative Hydration. Each of these components requires different fields to be stored associated with each served ad. For example, the Prediction component might run an experiment and want to store a field associated with it for processing later. Throughout the funnel, each component attaches relevant fields in a data structure called ImpressionMetadata, which is then persisted through AdMixer. Once the served ads receive impressions and engagements, our ads callback systems query this saved data and send it to all our downstream systems for processing.
From a system perspective, the journey of this ImpressionMetadata structure looked something like this:
While this system served us and our customers well for over a decade, with the growing demands of the business, it was increasingly difficult to append to this system and extend it without compromising on engineering principles. Here are a few of the problems we encountered:
- Low developer productivity: Different components in the AdServer funnel are owned by different teams. In order to add a field to the persisted data structure, developers need to understand services they did not closely work with. This means that design reviews, code reviews, and shipping take longer due to lack of context and shared understanding of the changes being made. Developers who work in the Ranking space need to understand how a field added in the Selection space might impact their service.
- Lack of clear ownership: The ownership of this data structure is not clear. The system that ends up persisting the data structure hardly ever adds new fields to it. The fields are added by product teams and their systems. However, the infrastructure teams maintain the system and are accountable for failures.
- Leaky interface: Because of the monolithic data structure, fields that should be known only to the Ranking component ended up leaking into the Selection component, and so on. This makes the interface between systems easy to misinterpret, resulting in further technical debt.
- Error prone: A field added at the top of the funnel must be passed along to each component of the funnel, making the system extremely error prone. A developer might forget to pass the field through one of the components of the funnel, causing the requests to error out.
It was especially important not to solve this problem in isolation. We created a consistent feedback loop with our customers, developers in the revenue organization, who were to use this new system. We involved these customers at each stage of the project — from the inception of problem statements to onboarding them onto this new system. We derived these problem statements by interviewing our customers, doing extensive case studies in how previous products had been launched, and involving customers in our brainstorming sessions. As a result of these exercises, we validated the existence of the problems as well as the practicality of the solutions we set out to design.
What should the new system enable?
At the heart of every redesign are tradeoffs. It’s critical to clearly communicate the goals of a redesign of this scale, and to ensure that our customers and developers in the revenue organization will benefit from them. The following is what we wanted our system to achieve. Each of these goals is informed by the pain points we collected from our customers.
- Each problem space must be able to scale independent of each other. With the legacy monolithic data structure, it was impossible for different components to scale independently of each other. Instead, we wanted a system in which, for example, if prediction added fields that require more storage, other components would not need to scale themselves.
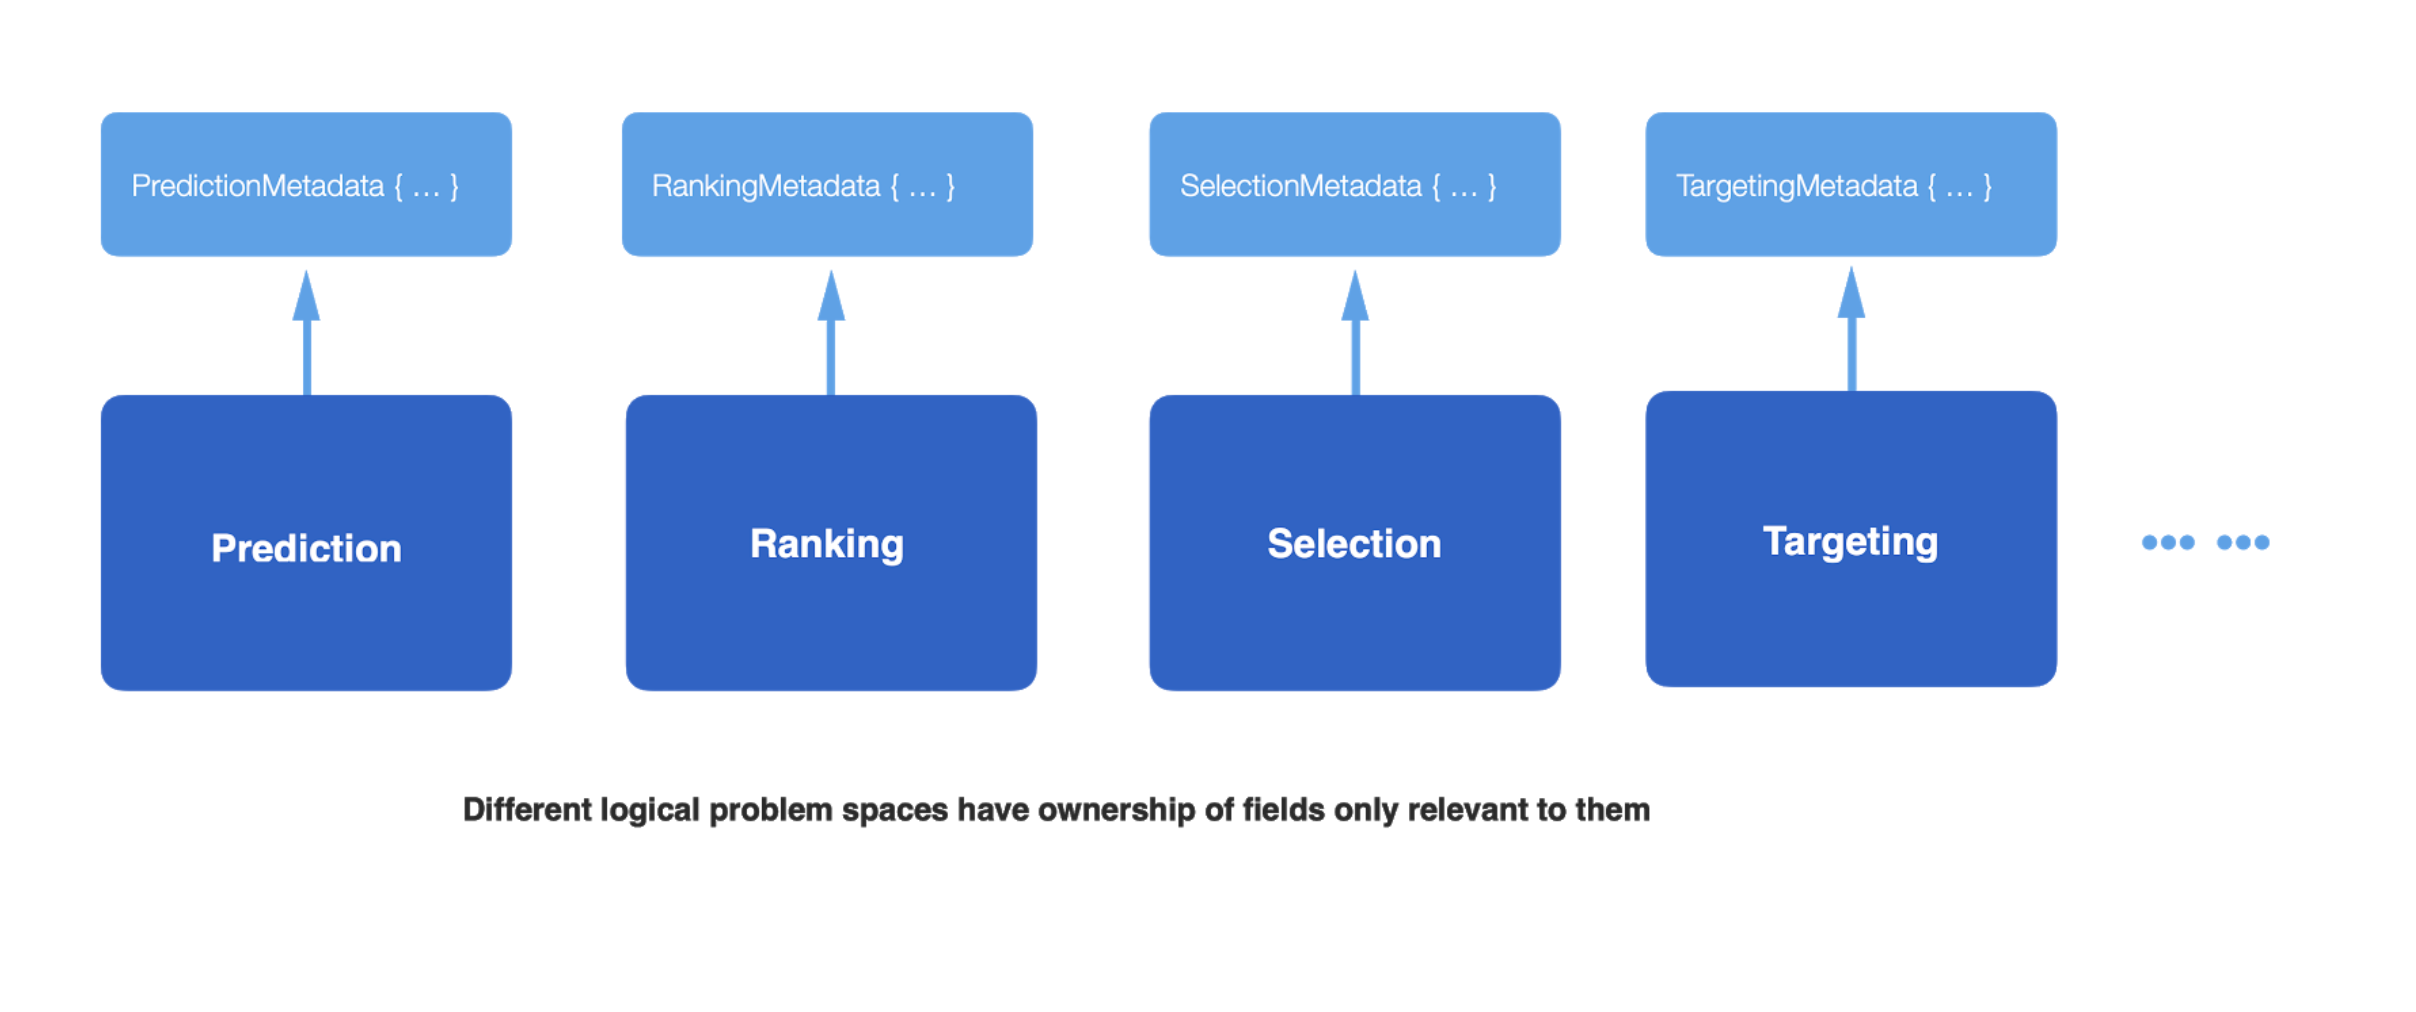
- Strong ownership of the fields by their producers. We wanted each system and team to own the field end to end. This would eliminate design and code reviews for fields irrelevant to other teams.
- Each component stores only the set of fields relevant to them. To solve the leaky interface problem, we wanted each component of the AdServer funnel to be aware only of the fields relevant to itself.
The next decade — a high level approach
To ensure that our solution really did solve the problems faced by our customers, we yet again took a customer-first approach in designing the solution. The first order of business was to understand the different problem spaces that we might have to decouple from the monolithic structure that existed. A simpler approach would have been to model these based on different teams in our organization. While straightforward, this approach would not have stood the test of time — for organizational structures are generally not modelled the way problem spaces that impact customers are, and are prone to constant changes. To ensure the longevity of the design, we defined multiple dimensions of problem spaces that our customers were trying to solve. Each logical problem space should be able to grow independently. We arrived at our logical separation of concern:
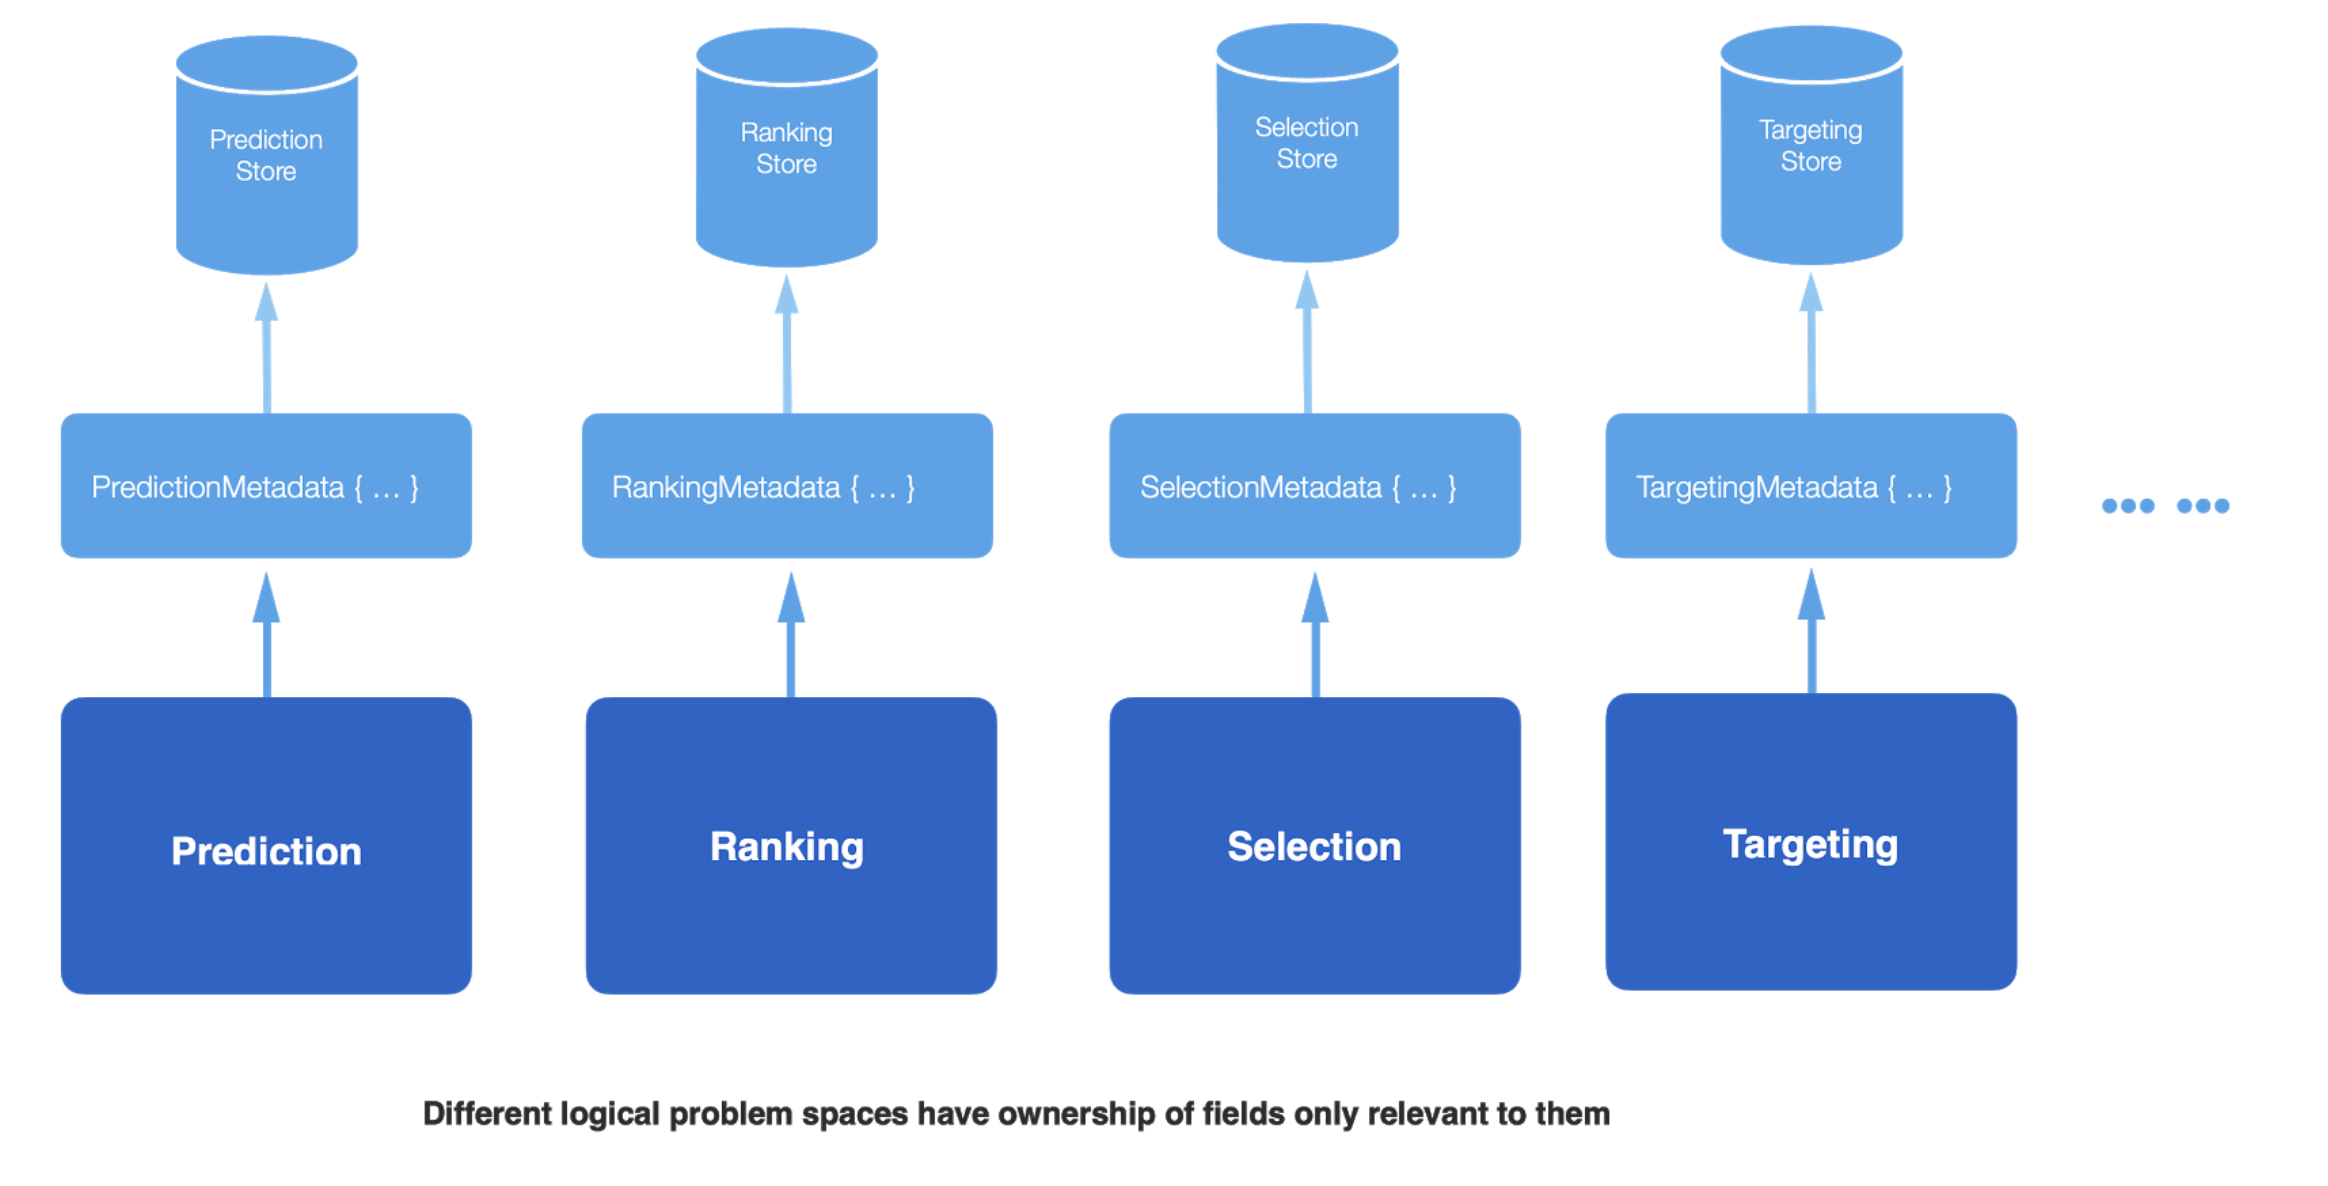
Now that each problem space was logically separated, we considered the benefits of physically separating the data being stored. Storing data in the same physical space meant that operationally, we were still coupled. Capacity planning, maintenance, and cost were shared between the teams. We started exploring a world where the problem spaces are both logically and physically separated. The benefits of this approach were clear: further separation of concerns, stronger interface between different components, and independent maintenance, cost, and operability of datasets.
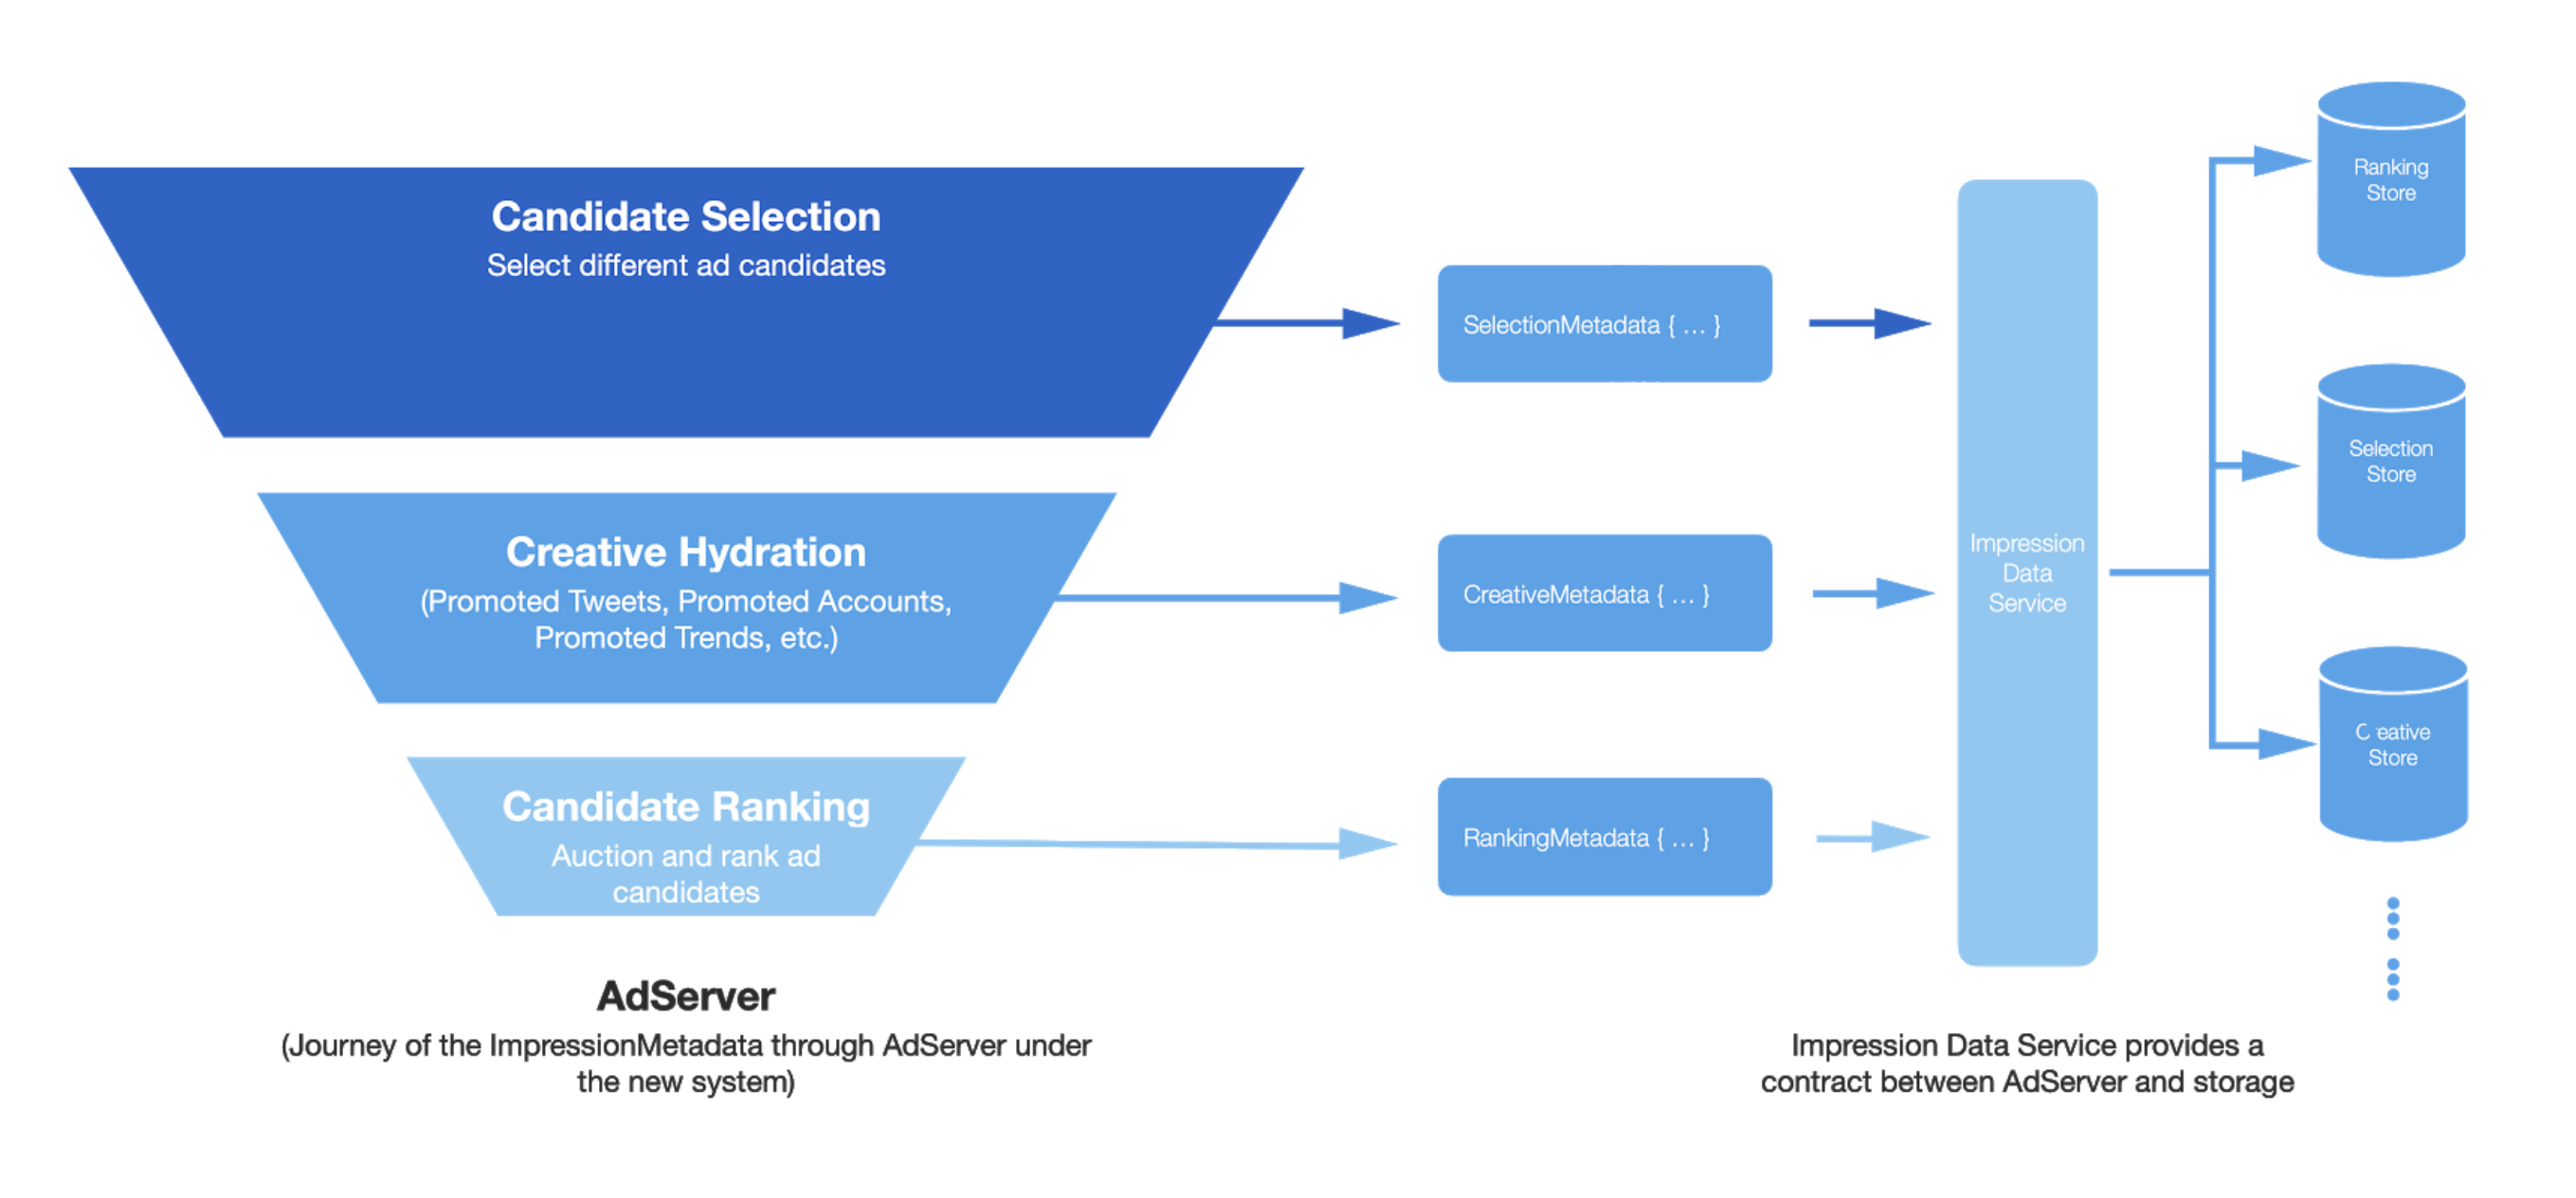
Finally, an interface was needed between the AdServer funnel and multiple datastores. We called this Impression Data Service. This microservice is in charge of storing and retrieving ad impressions for all ads served. This interface ensured a service level contract with the producers of the fields and helped us abstract away the core business logic of handling candidates and winning ads in a singular system.
In our new system, different problem spaces can independently grow, the interfaces between multiple components of the AdServer are not leaky, and developers working in one problem space do not need to gain context on spaces outside of their domain of expertise. This means that Candidate Selection, Creative Hydration, and Candidate Ranking can independently store metadata relevant to their problem spaces. While previously ads metadata had to be passed from one component to another, in our new system, each component calls Impression Data Service to store relevant metadata. Impression Data Service handles the business logic of correctly storing different metadata to different physical stores.
Migration and Testing Frameworks
Our first priority in migrating to the new system was to ensure that the data stored by the new system matches the data in the legacy system. Second, if at any time the data does not match, the new system must gracefully fall back to the legacy system. To ensure the integrity and correctness of the new system, we wanted a migration and testing framework baked into our system design. Given that the system handles all ads impression and engagement data, this presented an interesting problem to solve at Twitter’s scale. We developed multiple custom components in the pipeline to ensure the migration, especially at this massive scale, undergoes smoothly.
There are two major aspects of the migration and testing framework:
- Missing fields: We needed checks and balances in place to ensure that the new system does not have any missing fields.
- Mismatched values: When hundreds of fields, written by dozens of systems, are being migrated to a new logical and physical store, we expect some mismatches in the values of those fields.
Baking in these two components within our entire system itself made it a lot more predictable and reliable. Automatic fallback mechanisms were built in, which ensured that any time our new system isn’t consistent with our old system, the request would fall back onto the old system and log that as an error for the team to further resolve.
Because the shape of the data structures stored by the legacy and new system were quite different, we built a Thrift parser to recursively find field names and corresponding values in responses from the two systems. Once we brought the new system to 100% correctness, we could start shedding load from the older system and ramping up traffic to the newer system.
Physics and geometry calculations
While we were creating the Impression Data Service, many services that would call the Impression Data Service were not yet ready to test traffic patterns. Given the lack of dark traffic available to test on, we turned to theory to calculate the number of CPU cores, memory, and disk space required by the new system. We simulated a production environment. We created mock services and mock payloads. Then we extrapolated the metrics we needed to understand how we should tune memory required, disk space, network bandwidth, and geometry of the system.
Average number of cores required
To understand the total number of cores required by the new system, we multiply the average cores per request by the MAX_EXPECTED_QPS on the system:
Average cores per request = (time+ time) / QPS
Total cores required for max failover = MAX_EXPECTED_QPS * Average cores per request
We calculated MAX_EXPECTED_QPS using historical data snapshots and forecasts for traffic for the coming years.
Network Bandwidth
We needed to understand the total bandwidth we would require in the new system in each datacenter, taking into account failovers. The network bandwidth required by the system in each datacenter is determined by request and response size for the service.
To calculate the T bandwidth, we use:
(T / sec) / (Requests / sec ) E1
To calculate the R bandwidth, we use:
(R / sec)/ (Requests / sec ) E2
Extrapolation for Production
To extrapolate the numbers to production, we estimate the total R and Tbandwidth in GB/sec by multiplying E1 and E2 by MAX_EXPECTED_QPS.
To understand the geometry of each instance, the calculations were more straightforward. We know that the T bandwidth limits are per container and not impacted by the number of cores. On the other hand, the R bandwidth limits scale with whole units of CPU. To understand the theoretical lower bound on scaling and the number of instances required to support our system, we simply divide the bandwidth requirements of the system by the fixed T bandwidth of each host.
Conclusion
First, throughout the design and development of the new system, it was critical to stay customer focused and create a tight feedback loop with the current and future users of the system. Working with customers closely during the problem discovery, design, implementation, and testing phase enabled us to design a system that truly solved their pain points. When working with systems that have stood the test of time for over a decade requires the utmost care to go into validating the problem statements and solutions.
Second, for migrations of this scale, it’s important to build migration and testing frameworks that enable graceful degradation and fallback mechanisms into the system itself. This allows for a seamless and confident transition of traffic from legacy to new systems. As a result of our investment in this framework, our system achieved 100% match rate with the legacy system and provided us with multiple automatic fallback mechanisms.
If you're interested in solving such challenges, consider joining the flock.
Acknowledgements
Such a large scale effort would not have been possible without the cooperation of multiple teams. We would like to thank those who worked on this project: Andrew Taeoalii, Catia Goncalves, Corbin Betheldo, Ilho Ye, Irina Sch, Julio Ng, Mohammad Saiyad, Ranjan Banerjee, Siyao Zhu, Tushar Singh, Jessica Law, Juan Serrano, Mark Shields, Sandy Strong, Vivek Nagabadi, Kevin Donghua Liu, Rashmi Ramesh, Justin Hendryx, Karthik Katooru, Sean Ellis, Bart Robinson, Kevin Yang, Andrea Horst, Eric Lai, Ian Downes, Kristen Daves, Yogi Sharma, Ming Liu, Yiming Zang, Kavita Kanetkar, Brian Kahrs, Dan Kang, J Lewis, Kai Chen, James Gao, George Sirois, Fabian Menges, Somsak Assawakulpaibool, Steven Yoo, Tanooj Parekh, Jean-Pascal Billaud, Jiyuan Qian, Pawan Valluri, Paul Burstein, Xiao Chen, Yong Wang, Yudian Zheng, Tim Marks, Luke Simon, Helen Friedland, Sergej Kovalenko, Dwarak Bakshi, Marcin Kadluczka.