Insights
Experimenting to solve cramming
By
Tuesday, 7 November 2017
When we make a decision as significant as changing the number of characters available for Tweeting, we need to know it’s right. How do we figure that out? Through a rigorous evaluation process to ensure any change — especially one at the core of who we’ve been for more than a decade – improves everyone’s experience on Twitter.
Usually, any new feature we test requires just one experiment. As discussed earlier, however, we were anticipating regional heterogeneity: people from different countries send Tweets at different lengths and would react differently since they’d be affected by the experiment in different ways. So, how do we control for this?
To minimize this “within group variance” expectation, we first sorted countries by how much their primary language would be affected by the cramming problem, and then ran multiple experiments. For example, Germany is strongly affected by cramming, so it was placed in the large cramming group. The medium group included countries like Indonesia and France, while the small cramming group included others like Brazil and the Philippines. Grouping countries with similar behavior allowed us to understand results for those that were being impacted by this change in similar ways, and improve the power of statistical testing as well.
To confirm that the accounts in these test buckets were balanced before launching the experiment, we ran an A/A test — comparing apples to apples — looking for bucketing bias. Our most important metrics showed no significance, affirming our bucketing wasn’t biased. Knowing this allowed us to confidently test the feature in the treatment bucket in our A/B test.
This was a tricky experiment to measure; while we needed to test Tweet creation, everyone would be able see these new, longer Tweets. So, we had to design additional consumer analysis outside of the data provided in our standard A/B testing framework to also understand what the impact would be to people seeing longer Tweets in their timeline. We decided to track:
We selected our success metrics so they could be computed both in the control and treatment buckets. For example, while “total number of long Tweets” isn’t a great metric for the control bucket — it would be zero, obviously — it’s still useful to compute for ad-hoc analysis. For instance, when we launched the A/B experiment on September 26, we saw people in the control bucket bypassing the client-side validation to access and use the longer Tweets feature. Even though the number of longer Tweets coming from the control bucket was quite low, probably not affecting the experiment results, we decided to zero-out the metrics after the bypass maneuvers were fixed. We were careful to only zero the metrics without removing any accounts from the buckets, otherwise there could be carry-over effects.
When we looked at the total number of Tweets longer than 140 characters that were created, we noticed that 280-character Tweets are, in fact, quite rare: Only 5% of Tweets sent were longer than 140 characters, and only 2% were over 190 characters.
We also saw that there was minimal impact on timeline density, the number of Tweets you see on your screen at any one time, which was only affected by 0.3%. This means the timeline reading experience should not really change and people should still see about the same amount of Tweets in their timelines.
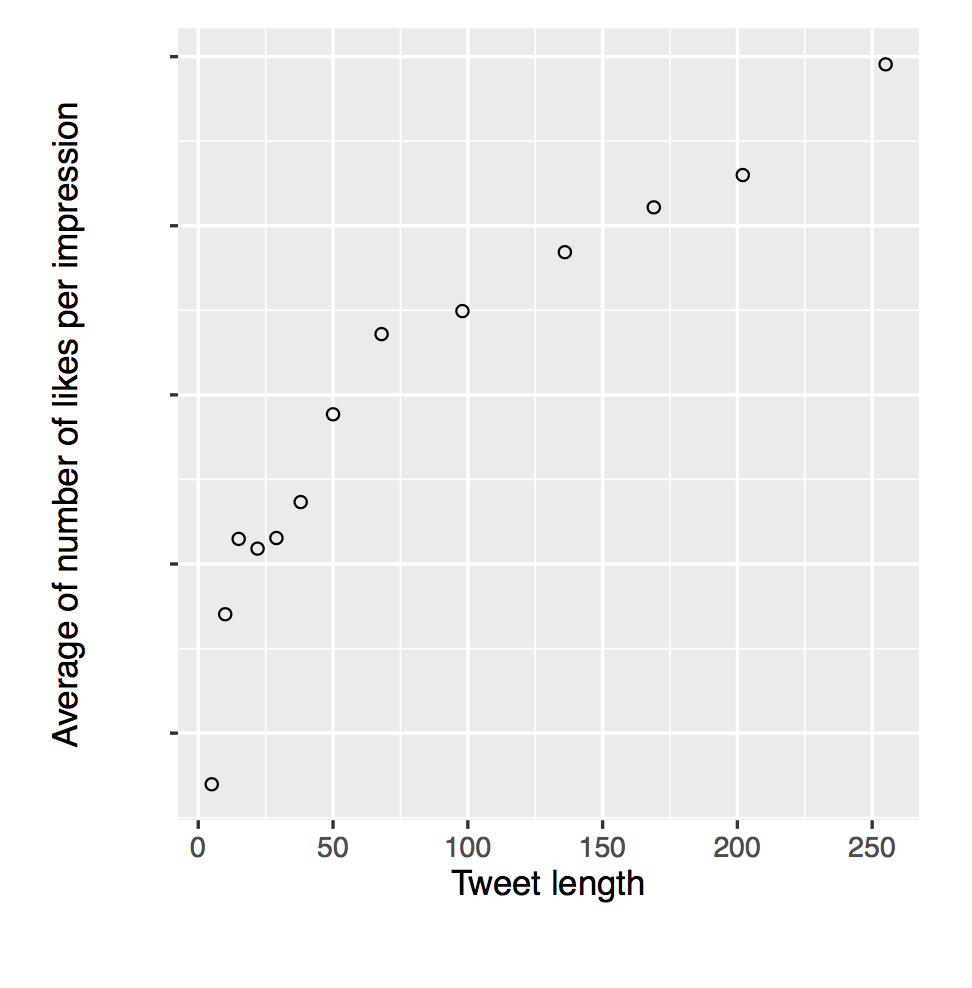
All the A/B testing metrics were individual, such as number of Tweets and number of Likes. To understand more complex levels of people’s behavior in the different buckets, we also performed offline analysis of compound metrics. One of the questions we wanted to answer was, “Are longer Tweets inherently better or of higher quality?” Sure, there are many examples of longer Tweets that don’t deliver much more than some well-refined, 140-character ones, but the comparison between short and long Tweets is valid when we consider averages, how many Likes they receive, on average, for instance. Another notable nuance is that Tweets which show up more frequently in other people’s timelines are intrinsically more likely to receive Likes, Retweets, or other engagement.
As you can see from this plot comparing the number of characters with number of Likes received per impression (the percentage of impressions received), the longer the Tweet is, the higher its quality. We used text-only Tweets for this analysis, since Tweets with photos or videos take up more screen real estate.
In conclusion, while we began testing longer than 140 character Tweets with the goal of making it easier to Tweet for everyone, we also wanted to ensure that we understood the consumption impact of this change. Through the rigorous experimentation described above, we were able to determine that longer Tweets are high quality and that the timeline reading experience remains the same. Tweet us your thoughts @TwitterEng and if this sort of work sounds interesting to you, check out relevant careers here.
Did someone say … cookies?
X and its partners use cookies to provide you with a better, safer and
faster service and to support our business. Some cookies are necessary to use
our services, improve our services, and make sure they work properly.
Show more about your choices.