Insights
Understanding Twitter conversations: A Wordle case study
By
Tuesday, 3 May 2022
On the Conversations Data Science team at Twitter, a piece of our job is understanding how conversations are happening on Twitter: what are people talking about, who is using new features, and how are they using them? Analyses like these can be essential to understanding our customers. In fact, that’s how the quintessential hashtag came about. Untangling these conversations is especially interesting as a Data Scientist at Twitter due to the scale of information we work with and ease of data access. For perspective, Twitter internally processes approximately 400 billion events in real time and generates petabyte (PB) scale data every day. Data is then stored in a variety of datasets for easy access. Most of these datasets are now in BigQuery, making it fast to do analysis on all data stored there. Having an easy way to access the over 1 trillion public Tweets and their associated metadata allowed us to analyze one recent trending topic of conversation on Twitter - Wordle.
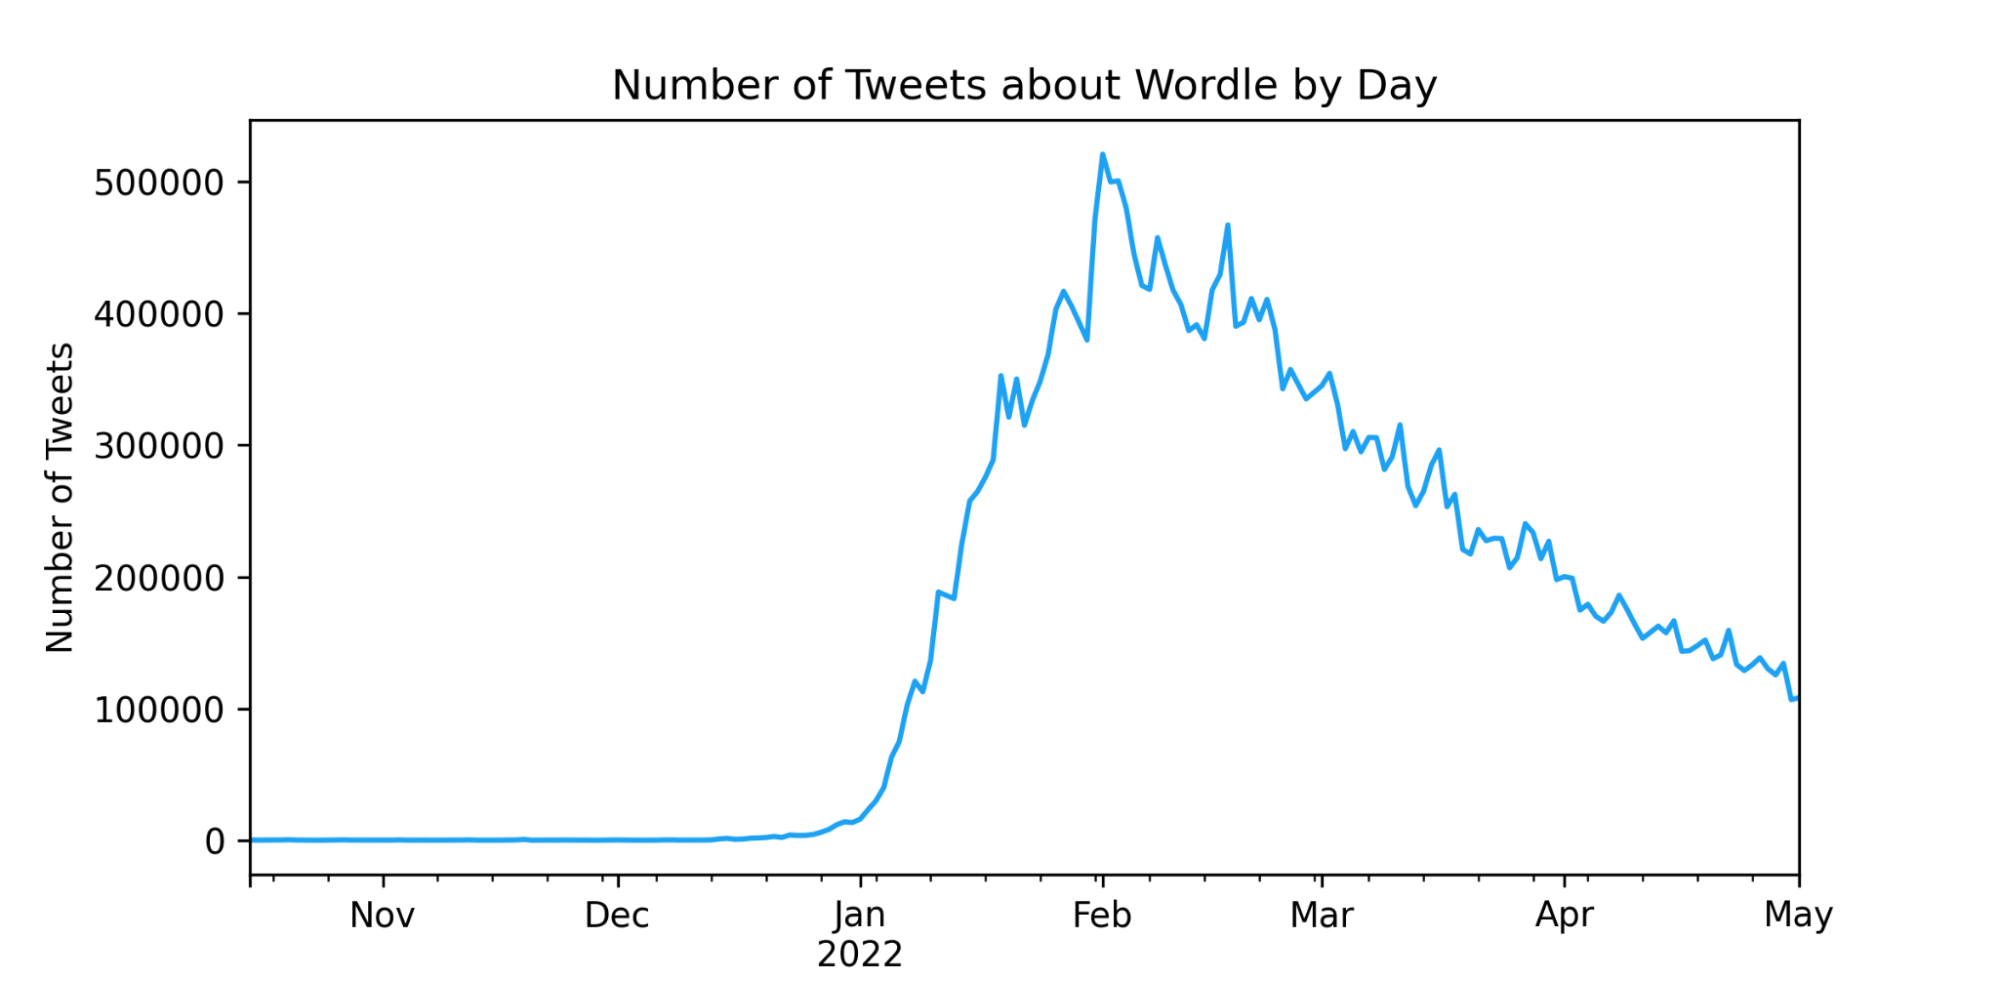
Since Wordle launched in mid-October 2021, it has been mentioned in 32.2M Tweets, by 3.3M people [1]. Wordle chatter on Twitter grew exponentially, from only 400 Tweets/day in December to 500K Tweets/day at peak. Tweets about Wordle have earned over 6.6T views, 58M likes, and 9M replies.
Looking at snapshots over time, it’s interesting to see how Wordle spread throughout the world. The levels of shading on the map below indicates the fraction of Tweets each day talking about Wordle in each respective country, with dark green signifying that more than 1% of Tweets on that day in that country were about Wordle [2]. Wordle became a mainstream topic of conversation in New Zealand earlier than any other country. It then quickly spread through Australia, the British Isles, Canada, and the rest of the world throughout the month of January 2022.
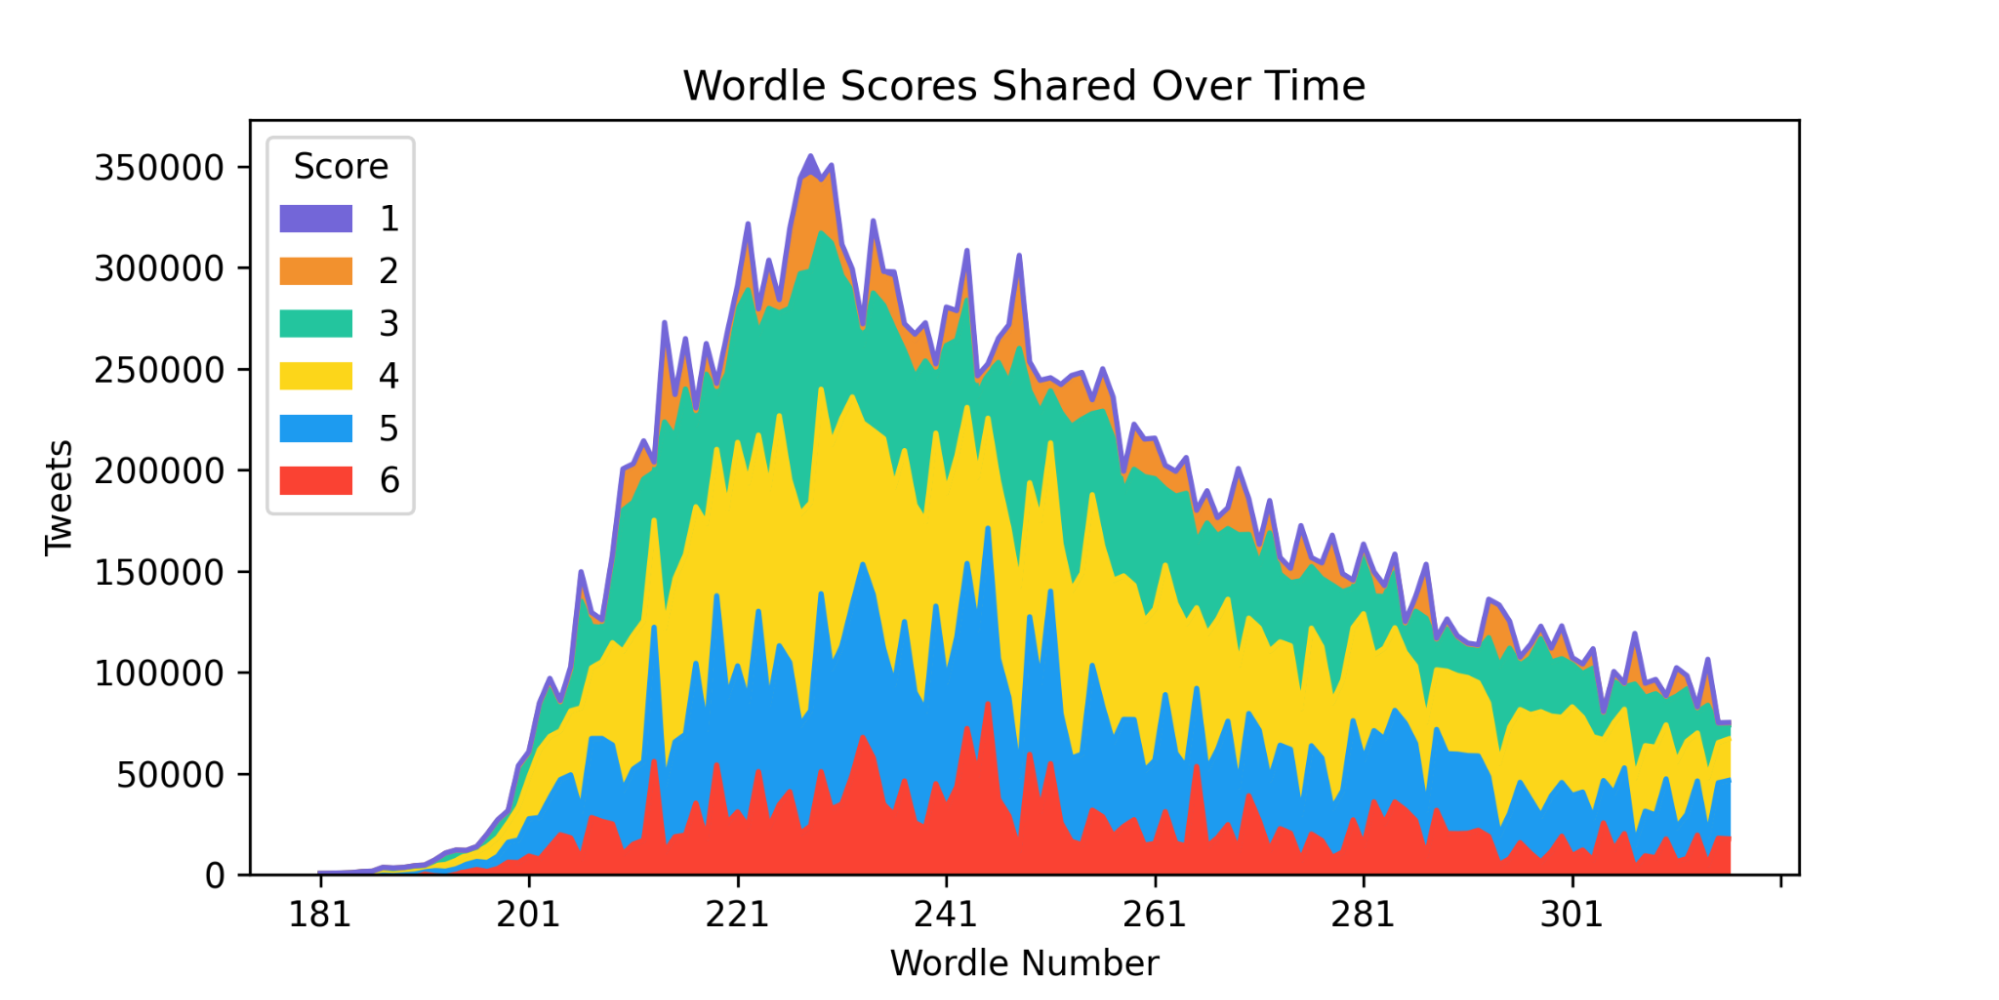
Many people have loved sharing their scores on Wordle. Thanks to the addition of the share button on December 16th and thus people sharing in a standard format, we could see that there have been 23.5M Tweets sharing English Wordle scores from 2.1M people.
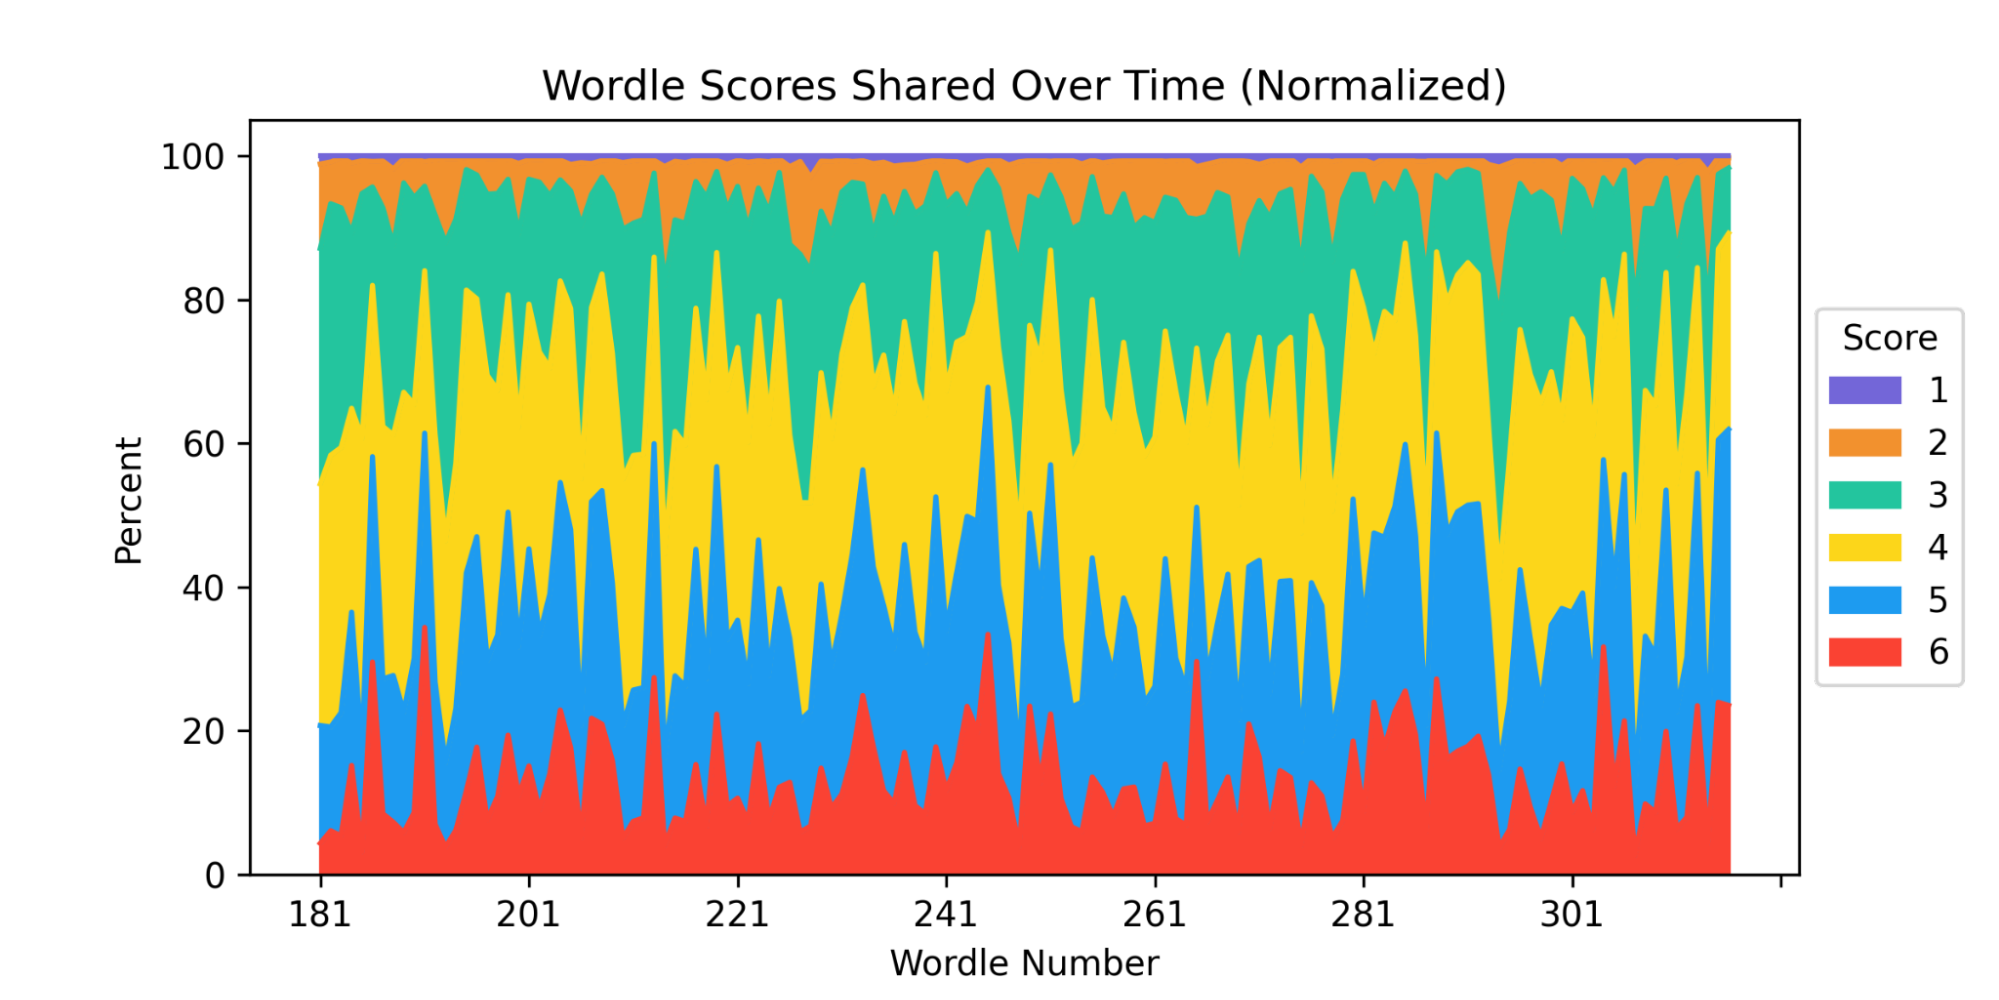
Looking at the distribution of scores shared over time, we could then hypothesize what puzzles were particularly easy or challenging.
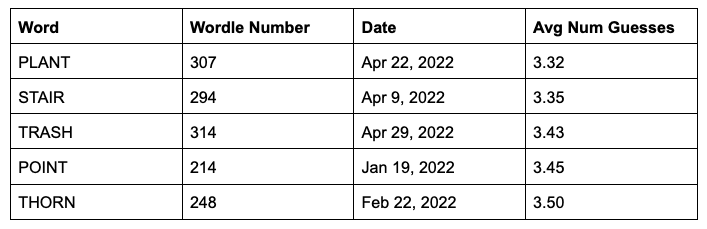
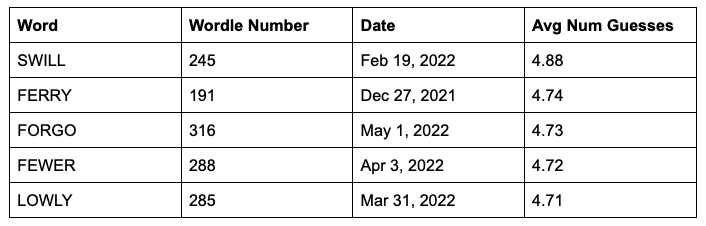
Of the people who Tweeted a solved score, an average score of 4.1 was shared, and the spikes in the graph help us see when many lower or higher scores were shared [3]. As outlined below, it looks like those repeated-letter words really tripped people up!
Easiest words:
Hardest words:
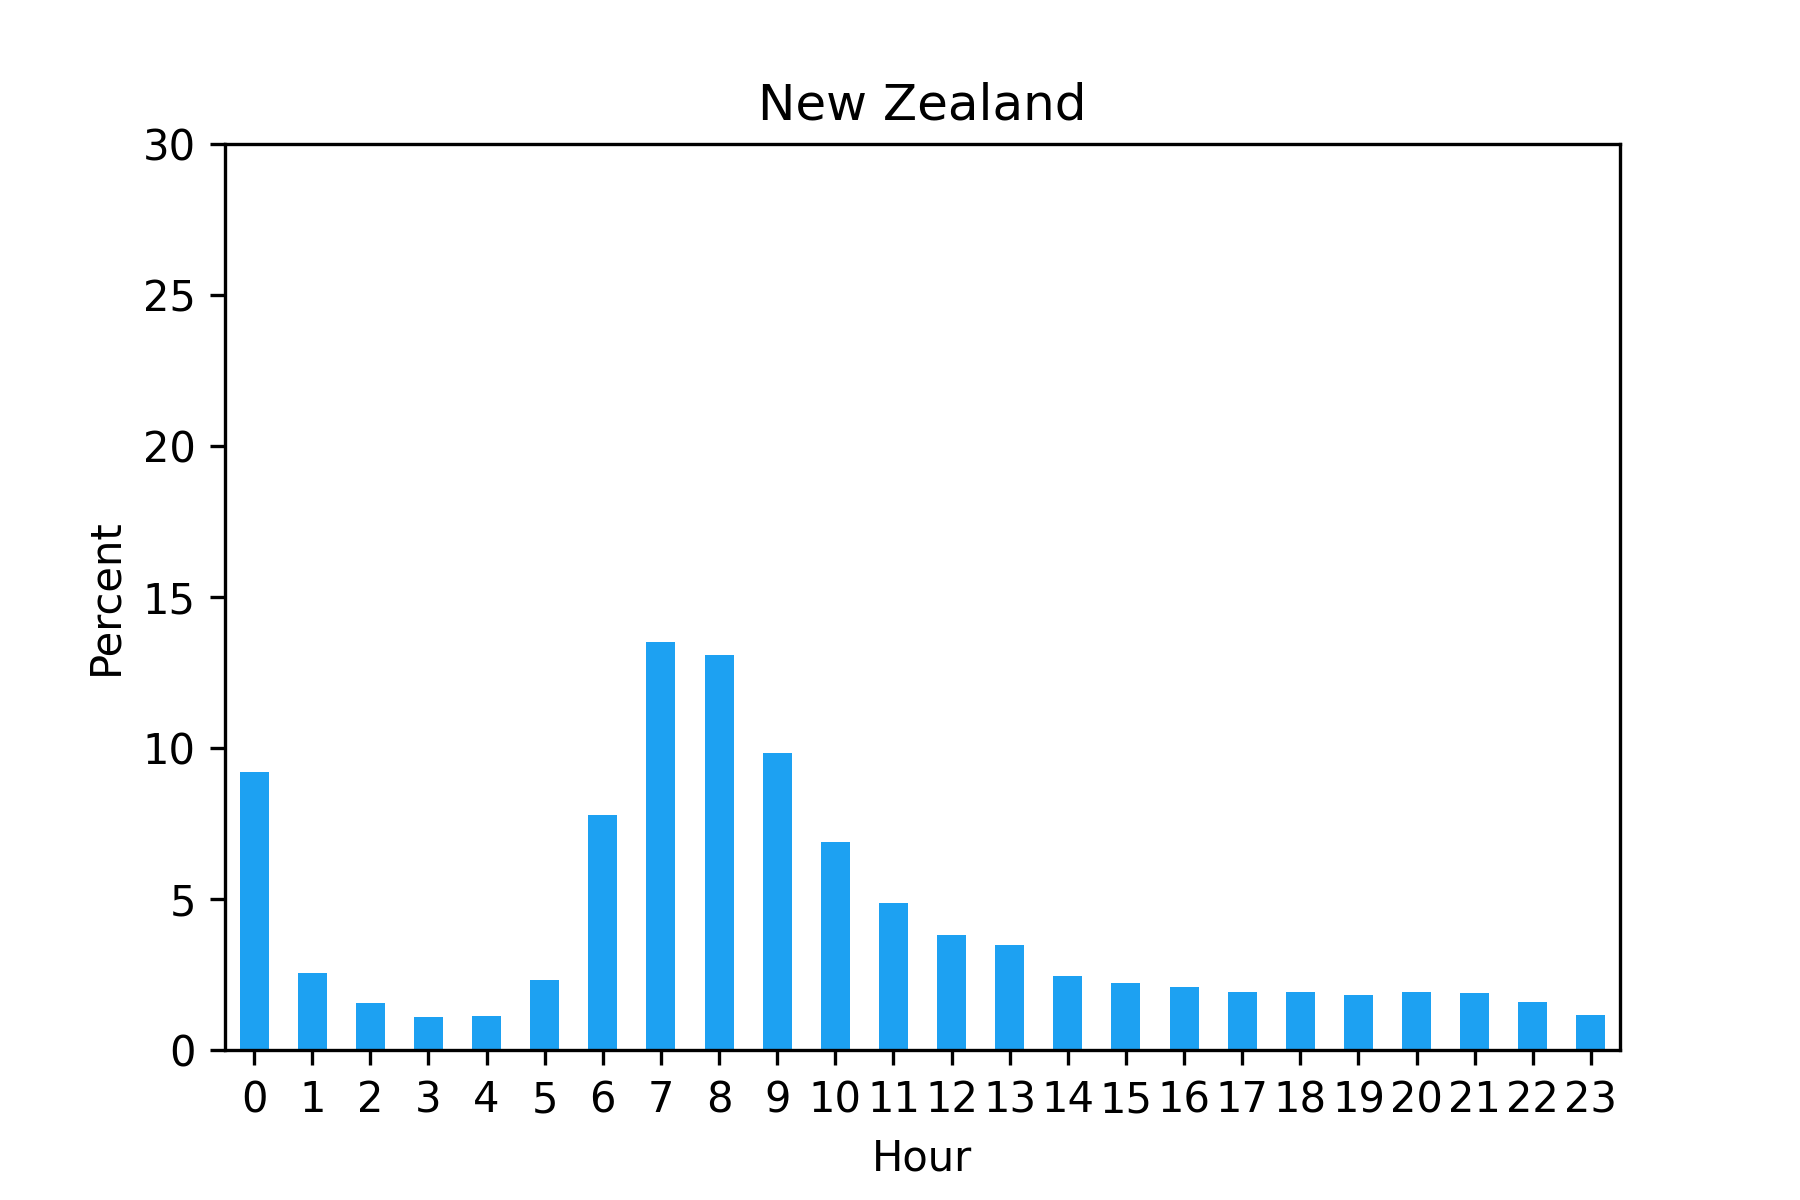
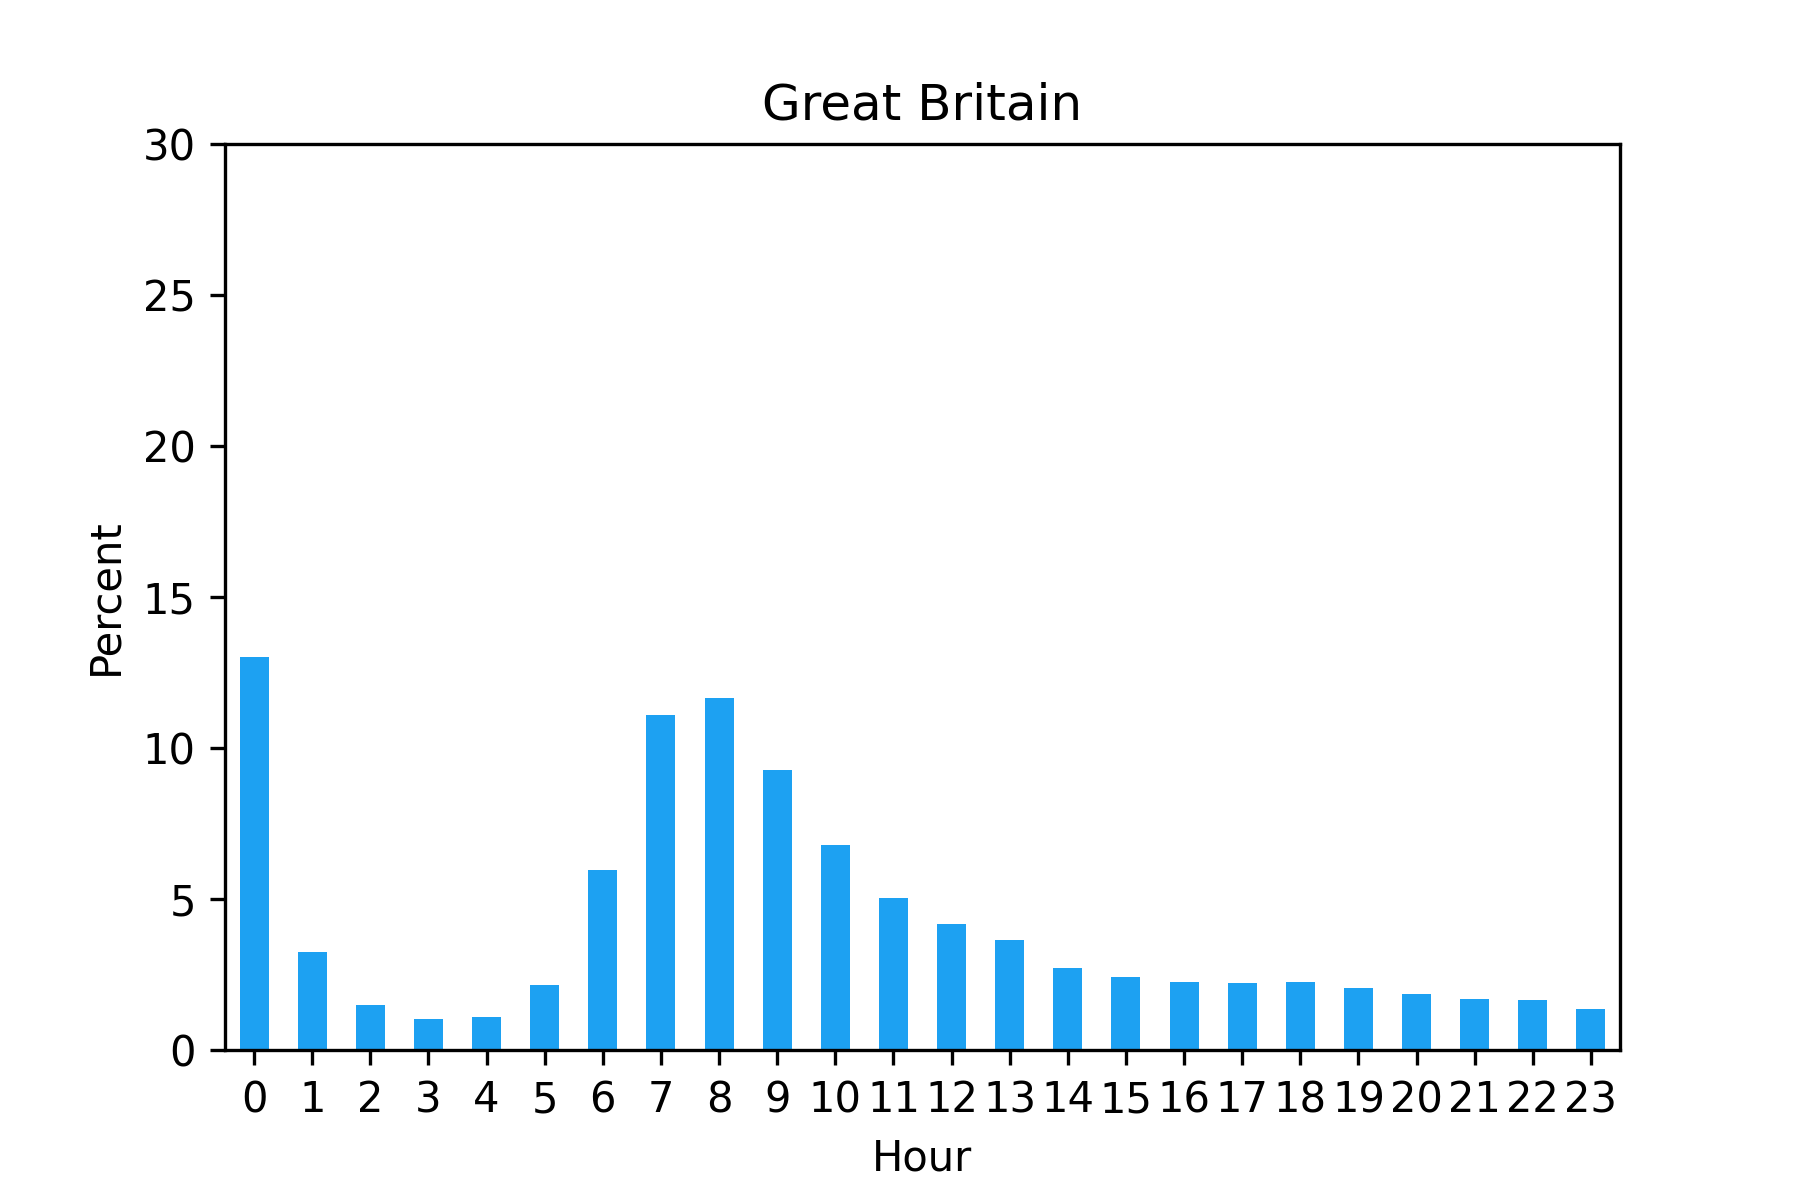
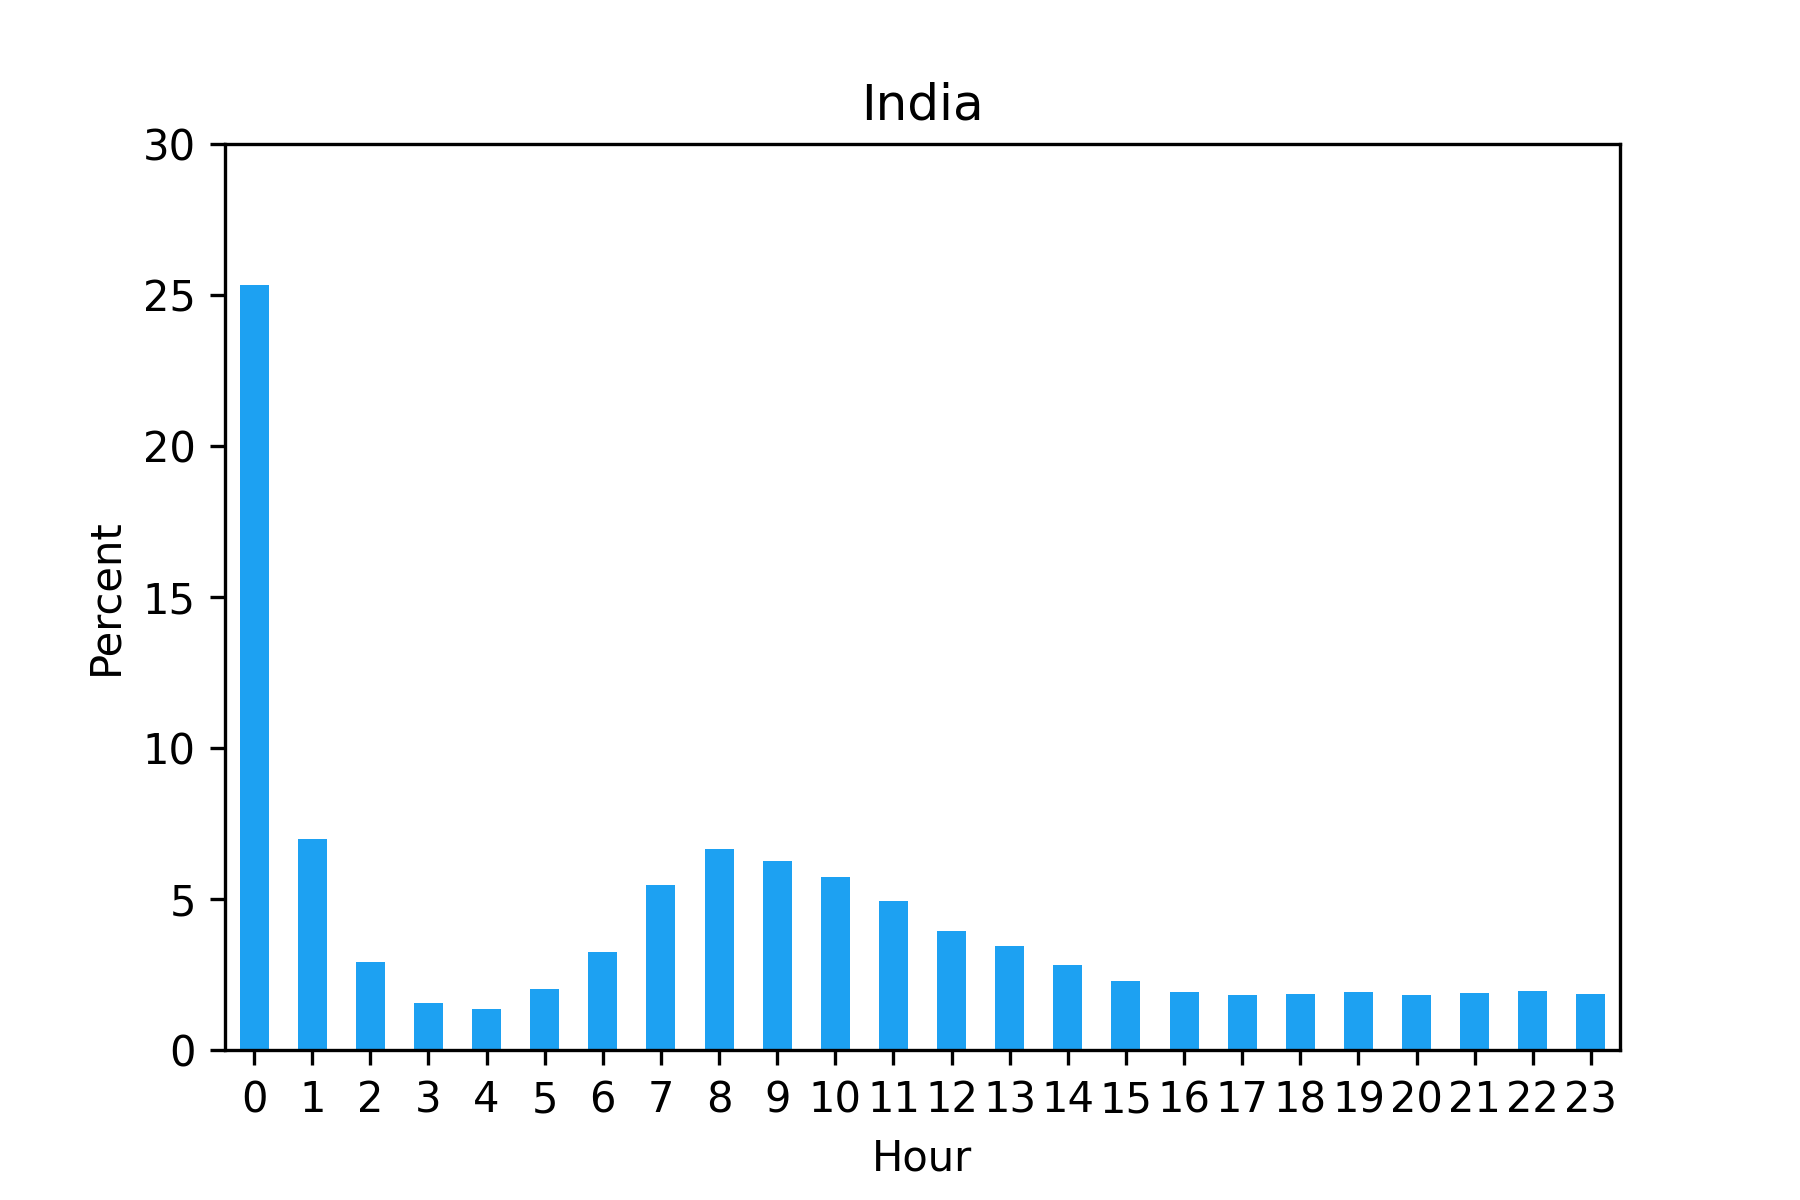
Looking at distributions of when people shared their Wordle scores on Twitter, it’s evident that many people stay awake until midnight to complete the puzzle right as it goes live – with almost 25% of India’s scores shared in the 12am - 1am hour. While the average scores shared at different times do not vary much, scores posted between 6am - 9am are the lowest, so maybe it is best to be a morning Wordler!
Once a cursory look at the data like this is completed, it often allows for deeper hypotheses to be formed and investigated. While our Wordle analysis ends here for now, stay tuned to see if we release any more data. In the future, we might want to dive deeper into the data and understand the drivers of this topic’s virality on Twitter, what other content was discussed in conjunction with Wordle, or what types of Twitter account holders are mainly interested in this topic. Or perhaps we’d want to partner with our research counterparts, who are experts in surveying customers, to dive deeper. Our quantitative partners can run large-scale surveys with Twitter customers to reveal general trends. Our qualitative partners run surveys on a much smaller number of customers, but are able to go much deeper in doing so. Having an understanding of behaviors through data, surveys, and interviews gives us a much richer understanding than just one data source alone. Data science, quantitative, and qualitative partners all work together as Twitter is releasing a new feature or investigating the release of a new feature so that we can deeply understand the space and the needs of the people on Twitter to ensure that we are building the best product that we can. Insights from these three partners are critical in informing the design and functionality of features, along with what features would be beneficial for Twitter to implement.
If you’d like to conduct similar analyses like these, visit the Twitter Careers page. Data analysis like the above is only a piece of our role as Data Scientists at Twitter, with other pieces including causal inference, machine learning, and understanding metrics. The Twitter API is a great resource for getting subsets of the data and analyzing Twitter behavior on your own. My team in particular is focused on relationships and answering questions around ‘how can we facilitate better connections on the platform?’ So if that’s an area of interest for you as well, my DMs are always open!
---
[1] All stats and charts shared in this blog are current as of May 02, 2022.
[2] This only includes original top-level Tweets (and therefore excludes replies, Retweets, and quote Tweets).
[3] Of course this could be biased by what people are willing to share. It would be interesting to compare to the actual distribution of Wordle scores.
Did someone say … cookies?
X and its partners use cookies to provide you with a better, safer and
faster service and to support our business. Some cookies are necessary to use
our services, improve our services, and make sure they work properly.
Show more about your choices.