Infrastructure
MetricsDB: TimeSeries Database for storing metrics at Twitter
We covered Observability Engineering’s high level overview in blog posts earlier here and its follow up here. Our time series metric ingestion service grew to more than 5 billion metrics per minute, stores 1.5 petabytes of logical time series data, and handles 25K query requests per minute. Historically, we used Manhattan, our key value store, as the storage backend. Observability had the largest Manhattan cluster in terms of storage and requests per minute, and that scale became a limiting factor to support other use cases requested by our customers. We tried various short-term mitigation approaches, such as batching writes and coalescing related metrics together to deal with those problems. These changes helped to improve operability in the short term, but scaling continued to be a problem. We explored alternate OSS storage options with two goals in mind. First, to better serve our current scale and the scale that we would organically grow into over the next five years. Second, to provide features that we lacked, such as support for sub-minutely and additional tags on metrics. We were not able to find a good option that meets the requirements, and decided to build our own using the compression algorithm described in Facebook’s in memory TSDB: Gorilla. We went down that route and productionized the initial version of our new backend, MetricsDB, at the end of 2017.
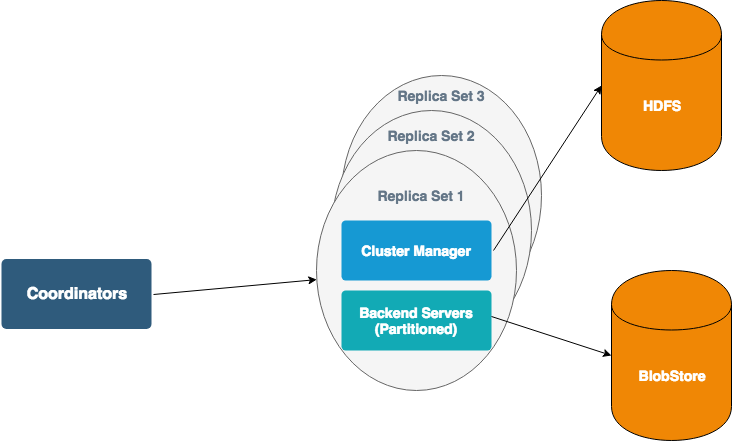
MetricsDB has 3 main components:
- ClusterManager: Each set of partitions has its own ClusterManager that is responsible for assigning partitions to backend servers. HDFS is used to store mappings from partitions to servers. The ClusterManager is responsible for redistributing partitions when we add capacity. Coordinators and BackendServers get updates from the ClusterManager when the mapping changes — they do not read from HDFS directly. The ClusterManager also does health checks on backend servers, and is used to coordinate deploys of the backend servers. We update a backend server only after making sure that other replicas owning same partitions are healthy.
- BackendServers: BackendServers are responsible for processing metrics for a small number of partitions. Each BackendServer keeps the latest two hours of data for all metrics in memory. The BackendServer also caches older data for frequently accessed metrics and time ranges. The servers checkpoint in-memory data every two hours to durable storage, Blobstore. We are using Blobstore as durable storage so that our process can be run on our shared compute platform with lower management overhead.
- Coordinators: Coordinators are responsible for routing requests to all replica sets and validates desired quorum constraints are met.
Multi-zone support: Our previous data store, Manhattan, was not zone aware and forced us to maintain multiple datasets for each of the zones that we supported. MetricsDB is multi-zone compliant and handles metrics from several different zones. We currently run MetricsDB only in our main zones. Persisted data is replicated to other zones via Blobstore’s built-in replication.
Partitioning of metrics: Observability is a write-heavy workload. Only ~2% of metrics written are ever read. It is also important to support even more metrics, at finer granularity, for quickly identifying and resolving incidents. We know from our experience with Manhattan that sending one metric in each request brings scaling challenges. We address this problem by using a custom partitioning scheme to batch a write request from “collection agent” all the way to storage system. This custom partition scheme uses consistent hashing on (zone+service+source) to route requests to specific logical backend partition and reduces the number of individual metric write requests per minute from over 5 billion to under 10 million. This also distributes requests evenly so large services and small services can co-exist and share shards, avoiding the overhead of having custom configuration to set up different numbers of shards for different services. In production, we are able to achieve a very low variance of 200 requests per minute between high loaded partition and least-loaded partition.
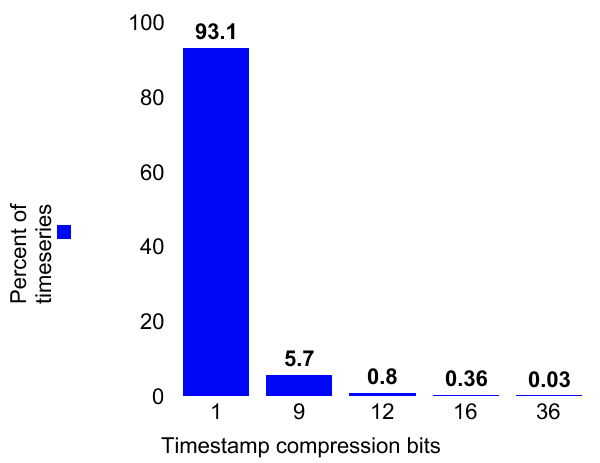
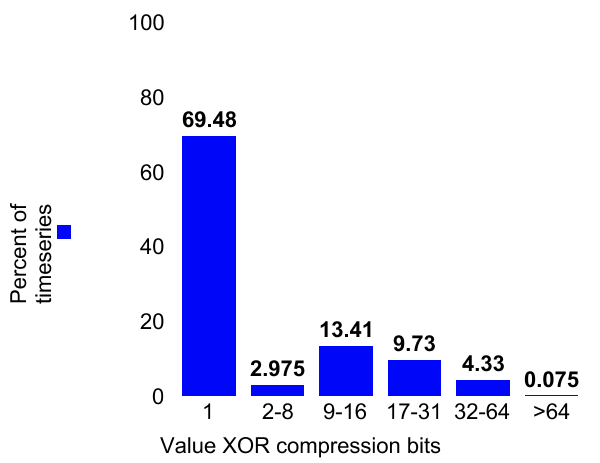
Compression efficiency : The Gorilla white paper identifies compression algorithms that are very efficient for observability data and achieve 95% space compression. We have implemented these algorithms and achieved similar results in production.
Ninety-three percent of timestamps can be stored in 1 bit and almost 70% of metric values can be stored in 1 bit. Further, only ~15% of metrics require more than 2 bytes for storing values. Overall, this helped reduce storage usage by 1.2PB.
Rollout challenges:
Consistency:
MetricsDB has replication factor of three. We initially designed the system to require at least two successful writes to acknowledge a write and planned to read from only a single replica. We chose single-replica reads approach with assumption that the engineers using monitoring stack generally care about trends and aggregates of metrics (request count or success rate) rather than individual data points. However, we found that many customers set up alerts on missing data to identify an unhealthy service. These missing data alerts would fire if the replica that responds first doesn’t have the data for the more recent minute. We switch to quorum reads (2/3) to address this issue.
There was an additional issue with inconsistencies in aggregates. This is observed when write failed in two of the replicas after multiple retries. In this case, only one replica will have the data for a specific metric. Aggregates will show a different value when that replica is included vs when it is not. It was not acceptable to wait for all three backend responses for all requests because this would cause high tail latencies. To workaround this problem, we introduced a two-level timeouts. MetricsDB coordinators have lower ‘first-level timeout’ to wait for all three replicas’ response. When that timeout expires, the coordinator will return if it has received responses from at least two replicas. There is a second timeout that will cause and actual failure to be returned if we have still not gotten two responses. This has increased p99 latency marginally (latency is still an order of magnitude better than key value store), but made the data more consistent. We are in the process of adding better replica reconciliation using Kafka queues to improve the consistency further.
Running MetricsDB on a multi-tenant compute cluster:
We started MetricsDB on our shared compute cluster to both speed time-to-market and to minimize operational overhead for the team. MetricsDB was the first stateful service to run a shared compute platform at Twitter. Running on a dedicated cluster was not an option because the size of the cluster would have been too small to be safe. We would not have had sufficient rack diversity and a single server failing would have been detrimental to the service availability.
On a shared compute cluster, an instance can be drained or restarted at any time for maintenance by the Compute team. This resulted in availability problems if two or more replicas are drained at the same time because our compute team was unaware of MetricsDB topology. We initially resorted to manual coordination and ad hoc tooling to deal with the problem. The Compute team helped us by adding support for stateful services such as Coordinator based SLA and SLA Aware updates.
Service level aggregates:
While MetricsDB has reduced latency by a factor of five, doing read-time aggregation for a service with a large number of sources with a low latency was challenging. For example, loading dashboard with time series data for more than 10,000 sources over two weeks of data often timed out. To make such queries more responsive, we added a new service that does write-time aggregation called “counters”. Counters architecture has two major changes:
Better consistency
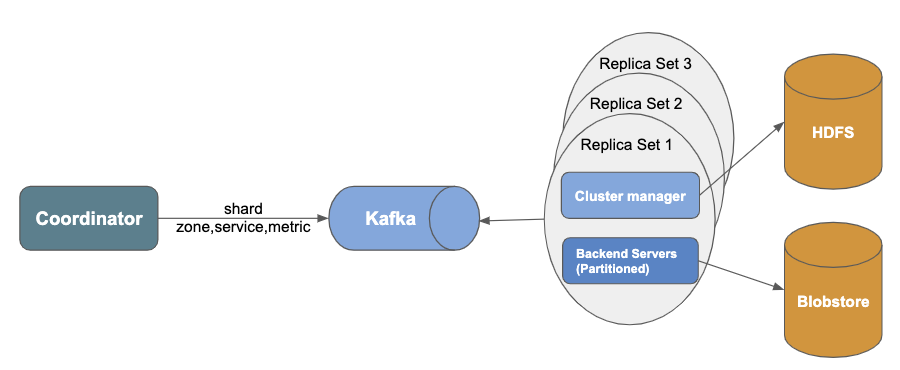
Data inconsistency is a bigger problem with aggregates than with raw data points. Replicas can miss partial data and compute different aggregate value for the same timestamp. These are impossible to reconcile on the read path. To solve this, we introduced Apache Kafka between coordinator and backend servers. We also removed AppendLog from counter cluster because Kafka acts as AppendLog.
New partitioning scheme
As described earlier, for raw data points, we used partitioning based on (zone, service, source). To aggregate metrics per service, we introduced a new partitioning scheme (zone, service, metric) so that a metric that belongs to the same service lands on the same partition. This provides better data locality for doing aggregations. In practice, this also gave marginally better balancing than (zone, service, source) partitioning. However, metric-based partitioning brought more challenges in ingestion path than source-based partitioning, because a write request from collection agent needs to be split into multiple requests based on partitioning scheme. Apache Kafka producer has an option to batch requests, which helped us reduce the number of requests to the queue and storage.
In the first version, we provide most common aggregations, 'SUM' and 'COUNT' for all metrics based on service. We plan to support other types of aggregations in near future.
Summary
Using a custom storage backend instead of traditional key value store reduced the overall cost by a factor of 10. This also reduced latency by a factor of five. More importantly, this enables us to add other features that require higher scale. In addition, write time aggregations based on service improved responsiveness significantly while reducing the load on MetricsDB. We plan to add support for dimensions, sub-minutely granularity soon.
Acknowledgements
We couldn't have achieved this without the hard work and dedication of everyone in Infrastructure engineering. Special thanks to Alex Angelo, Charlie Carson, Honggang Zhang, Muhammed Serdar Soran, Ning Wang, Ravi Kapuganty, Vishnu Challam